Observability Enhancements in ProxySQL 2.1 with Prometheus & Grafana

How can ProxySQL be monitored using Grafana and Prometheus using the all new Prometheus exporter introduced in ProxySQL v2.1+?
As you may already know, ProxySQL v2.1 includes a built in Prometheus exporter! Meaning what exactly? You can monitor ProxySQL directly without deploying or maintaining any additional Prometheus exporters. This greatly simplifies deployment as well as management of your ProxySQL observability stack, deploy less and have less moving parts to look after. No need to check if the Prometheus exporter is running, its enough to know ProxySQL is running! You can even use the exposed /metrics endpoint to gather statistics for ad-hoc monitoring or integration with your own custom monitoring stack, in this article we’ll explore how this can be integrated with Prometheus and Grafana using the freely available sample monitoring stack provided in the ProxySQL Github repositories.
The tools we’ll use are:
Docker CE(or Enterprise) anddocker-composeto deploy ProxySQL as well as a Prometheus / Grafana monitoring stack- A running instance of
MySQL, we will need a MySQL backend in order to generate statistics for ProxySQL to expose Gitto clone the ProxySQL Grafana / Prometheus stack repository (you can also just download this here and skipgit)- Your favorite web browser to access the Grafana Dashboards!
The following 6x step process is all you need to get up and running even if you don’t have ProxySQL, Grafana or Prometheus installed. It does however assume you at least have an instance of MySQL ready to go. If you already have ProxySQL installed and configured (i.e. with defined MySQL backends / credentials) you can skip directly to Step 4 and enjoy a 3x step process instead, just make sure you’re running ProxySQL v2.1+! Steps 1-3 are included here for the sake of completeness and to provide an easy method to setup a proof-of-concept… spoiler alert: steps 1-3 do not contain all the steps recommended for a production ProxySQL deployment, make sure to have a read through our online documentation to get the full picture of all that is needed.
Without any further delays please read on to see what is required to setup your own Prometheus & Grafana stack for monitoring ProxySQL!
Step 1: Create a configuration file for ProxySQL (make sure to tweak the mysql-server_version variable according to your backend MySQL version, this sample configuration file assumes version 8.0.21)
cat
 	- You can also of course just run MySQL within Docker (by specifying this in a unified `docker-compose` file and specify the container name), the choice is yours.
In this example we use the Docker Gateway IP, to re-iterate, in your deployment substitute your MySQL
backend IPs as per regular ProxySQL configuration:
INSERT INTO mysql_servers (hostgroup_id,hostname) VALUES (0,“172.17.0.1”);
LOAD MYSQL SERVERS TO RUNTIME; SAVE MYSQL SERVERS TO DISK;
Now we also need to make sure to add a user that can authenticate to ProxySQL / MySQL. Again, you can skip this step if you have already defined your `mysql_users` as well as the `monitor` user. These users of course need to be defined in both MySQL and ProxySQL, the article assumes the MySQL user is already configured and all we need to do is configure this user in ProxySQL. By the way, its worthwhile to point out that when connecting to a MySQL 8+ backend users should be created using `mysql_native_password`, see the [MySQL 8 ProxySQL Configuration page](/documentation/mysql-8-0/) for more details.
INSERT INTO mysql_users (username,password) VALUES (“root”,“root”);
LOAD MYSQL USERS TO RUNTIME; SAVE MYSQL USERS TO DISK;
EXIT;
Finally we should ensure the ProxySQL Monitoring user (`monitor_username` / `monitor_password`) defined in the ProxySQL configuration has also been created in MySQL - the commands you need to execute to create this user can be found below for convenience:
CREATE USER “monitor”@”%” IDENTIFIED BY “monitor”; GRANT usage,replication client ON . to monitor@”%“;
Great, so now we have ProxySQL up and running and it is connecting to MySQL. Before we can start seeing Prometheus stats being exposed by ProxySQL we should also enable the REST API.

**Step 4:** Enable and configure ProxySQL's REST API in ProxySQL Admin:

`mysql -h127.0.0.1 -P16032 -uradmin -pradmin --prompt "ProxySQL Admin> "`
Within ProxySQL Admin:
SET admin-restapi_enabled=“true”; SET admin-restapi_port=6070;
LOAD ADMIN VARIABLES TO RUNTIME; SAVE ADMIN VARIABLES TO DISK;
And that was all that was needed to enable the Prometheus exporter! You can verify Prometheus stats are being exported this by checking the `/metrics` url on REST API port of your ProxySQL instance e.g. [http://localhost:16070/metrics](http://localhost:16070/metrics) (or [http://localhost:6070/metrics](http://localhost:6070/metrics) if running locally and not via Docker).

At this stage we're ready to get cracking with the sample dashboards using the Docker compose setup available from our [ProxySQL repository here](https://github.com/ProxySQL/proxysql-grafana-prometheus.). So lets clone the repository and adjust the configuration for our environment:

**Step 5:** Download and configure the ProxySQL Grafana / Prometheus sample stack
git clone https://github.com/ProxySQL/proxysql-grafana-prometheus.git cd proxysql-grafana-prometheus/ vi prometheus/prometheus.yml
We need to modify the following section to reflect our ProxySQL servers, note that in this case I am using the bridge IP address and forwarded port. This is not ideal, instead the `docker-compose.yml` should either include the ProxySQL container or it should at least be defined on the same Docker network however it works just fine for illustrating the basic configuration of this stack.
-
job_name: “proxysql” scrape_interval: 5s
static_configs: - targets: [“172.17.0.1
”]
In case you are not using NAT here as you are connecting directly to your ProxySQL instances you would define port 6070 (as defined in ProxySQL"s `admin-restapi_port` variable - this is the port to scrape). If you have multiple ProxySQL instances to monitor you should list all of them in the `targets` as follows `- targets: ["10.0.0.1:6070","10.0.0.2:6070","10.0.0.3:6070"]`.
The default Grafana credentials are "admin" / "foobar". These can be edited in the file `grafana/config.monitoring` by adjusting `GF_SECURITY_ADMIN_PASSWORD=foobar` to your desired `admin` password.
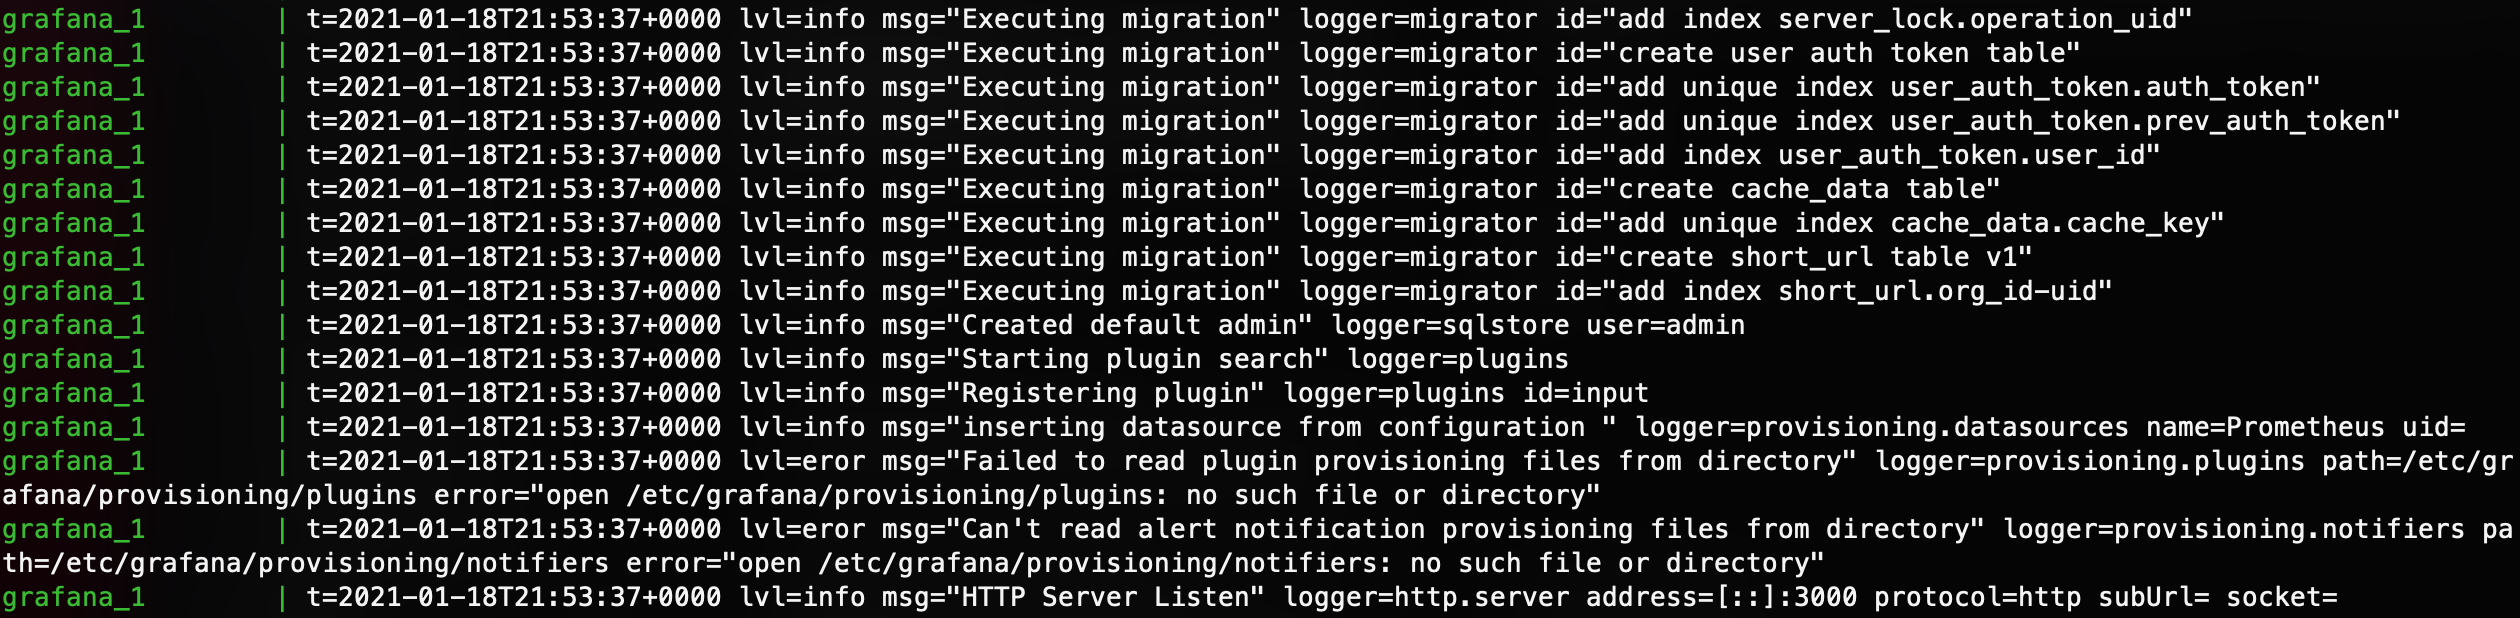
Our configuration is now ready and all we do is run `docker-compose up` and to launch, within a few seconds the `info` message `"HTTP Server Listen"` will appear indicating that the stack is fully up and running.
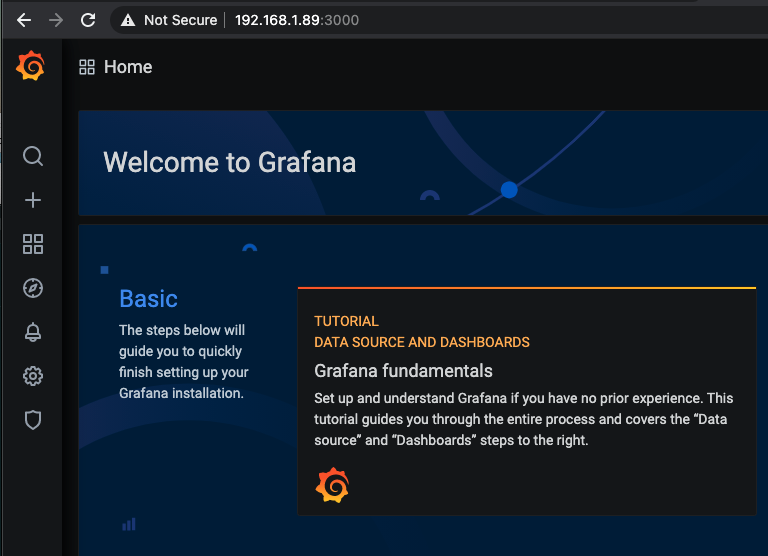
**Step 6:** Accessing Grafana and viewing dashboards!
You should now be able to access Grafana at [http://localhost:3000](http://localhost:3000) or [http://:3000](http://<your-internal-ip>:3000) using the default credentials or any custom credentials specified previously in the `GF_SECURITY_ADMIN_PASSWORD` option.
Click the "Home" button at the top right and you will be presented with a drop-down showing two dashboards.
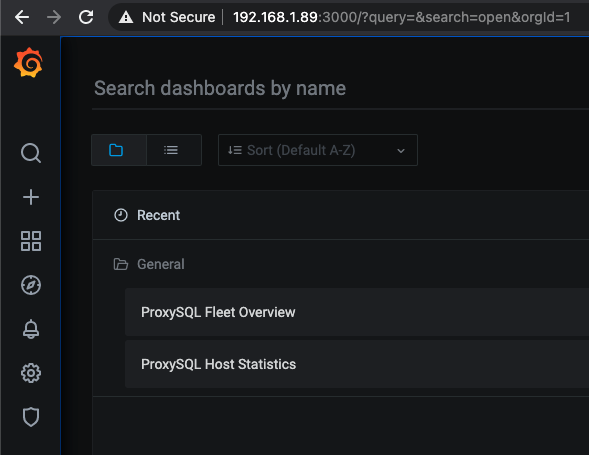
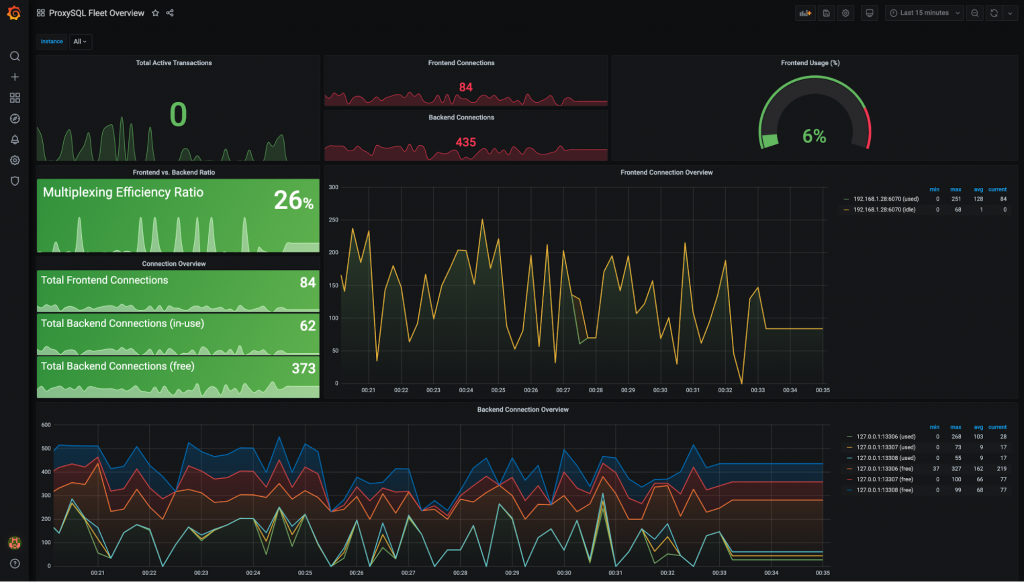
For a general overview of all the ProxySQL nodes within your fleet review your “**ProxySQL Fleet Overview”** to understand the fleet’s “aggregated database workload”. Quickly understand the capacity of your ProxySQL deployment by reviewing your cluster-wide statistics and gain crucial data related to the performance and efficiency of ProxySQL by monitoring statistics such as the **Multiplexing Efficiency Ratio**, **Active Transactions**and **Backend vs. Frontend Connections**.
**All stats can be filtered up to the instance level if you wish to only view a specific node or even a subset of nodes** and cluster-wide hostgroup stats can be easily aggregated to get quick statistics on the total usage of a backend instance by all of the connected ProxySQL instances! When you are interested in getting more details on a specific host its time to drop into the “**ProxySQL Host Statistics”** dashboard which provides highly detailed “per host” statistics covering many areas including **connection pooling, command types, prepared statements, query cache, routing, clustering**and**much much more!!!**
At this point, we'll hand it over to you to further explore, customise and come up with new ideas on how to make ProxySQL monitoring better than ever before! Feedback is always appreciated, especially when its about improving and extending the tools we provide so please do reach out with your ideas and improvements by opening a [Github issue](https://github.com/ProxySQL/proxysql-grafana-prometheus/issues/new/choose) or via our [ProxySQL contact form](/contact-us).
#### [Happy ProxySQLing in 2021 with ProxySQL 2.1!](https://github.com/sysown/proxysql/releases/tag/v2.1.0)
**Authored by:** [Nick Vyzas](https://www.linkedin.com/in/nvyzas/)