Aurora cluster promises a high availability solution and seamless failover procedure. However, how much is actually the downtime when a failover happens? And how proxySQL can help in minimizing the downtime ? A little sneak peek on the results ProxySQL achieves up to 25x less downtime and the impressive up to ~9800x less errors during unplanned failovers. How proxySQL achieves this:
- Less downtime
- “Queueing” feature when an instance in a hostgroup becomes unavailable.
So what is ProxySQL? ProxySQL is a middle layer between the database and the application. ProxySQL protects databases from high traffic spikes, prevents databases from having high number of connections due to the multiplexing feature and minimizes the impact during planned/unexpected failovers or crashes of DBs.
This blog will continue with measuring the impact of an unexpected failover using proxySQL v2.3.2 in comparison to using the cluster’s writer endpoint, which is considered to be the middle layer between the application and the databases. In our setup we use a aurora mysql cluster 2.10.0 of db.t3.small class, having 1 writer instance and 2 reader instances. ProxySQL is installed on an EC2 instance on the same region as the cluster and we will use both sysbench and simple multithreaded bash script using the native mysql client. In this way we will verify the actual downtime in both use cases.
ProxySQL setup
ProxySQL natively supports Aurora as described in the following link. (https://proxysql.com/documentation/aws-aurora-configuration/)
ProxySQL configuration file
mysql_variables=
{
threads=2
max_connections=2048
default_query_delay=0
default_query_timeout=36000000
have_compress=true
poll_timeout=2000
interfaces="0.0.0.0:6033"
default_schema="information_schema"
stacksize=1048576
server_version="5.5.30"
connect_timeout_server=3000
monitor_username="monitor"
monitor_password="monitor"
monitor_history=600000
monitor_connect_interval=60000
monitor_ping_interval=10000
monitor_read_only_interval=1500
monitor_read_only_timeout=500
ping_interval_server_msec=120000
ping_timeout_server=500
commands_stats=true
sessions_sort=true
connect_retries_on_failure=10
}
Proxysql Aurora tables setup
Step 1. Create proxysql’s monitor user in Aurora cluster
create user if not exists monitor identified with mysql_native_password by 'xxx'; grant replication client on *.* to monitor;
Step 2. Configure aurora mysql instances on proxySQL
INSERT INTO mysql_servers (hostgroup_id,hostname) VALUES (1,'test-proxysql-0.asdfasf.eu-west-1.rds.amazonaws.com');
INSERT INTO mysql_servers (hostgroup_id,hostname) VALUES (1,'test-proxysql-1.asdfasf.eu-west-1.rds.amazonaws.com');
INSERT INTO mysql_servers (hostgroup_id,hostname) VALUES (1,'test-proxysql-2.asdfasf.eu-west-1.rds.amazonaws.com');
Step 3. Configure writer and reader hostgroups.
INSERT INTO mysql_aws_aurora_hostgroups(writer_hostgroup, reader_hostgroup, domain_name,writer_is_also_reader) VALUES (0,1, '.asdfasf.eu-west-1.rds.amazonaws.com',1);
LOAD MYSQL SERVERS TO RUNTIME;
SAVE MYSQL SERVERS TO DISK;
Step 4. Configure user
INSERT INTO mysql_users (username,password,active,default_hostgroup, use_ssl) values ('sbtest','sbtestsbtest',1,0, 0);
LOAD MYSQL USERS TO RUNTIME;
SAVE MYSQL USERS TO DISK;
Test and Results
For simplicity reasons we only directed traffic to the writer instance.
In both test cases(using proxysql and using cluster endpoint) we used the same sysbench test and the same mysql client bash script. As below:
sysbench --report-interval=1 --mysql-host=proxysql01 --mysql-port=6033 --mysql-user=sbtest --mysql-password=sbtestsbtest --mysql-db=sbtest --table_size=20000 --tables=4 --time=120 --threads=4 --skip_trx=off --mysql-ignore-errors=2013,2003,1290,1213 --db-ps-mode=disable --reconnect=1000 oltp_read_write
sysbench --report-interval=1 --mysql-host=test-proxysql-cluster.cluster-asdfasf.eu-west-1.rds.amazonaws.com --mysql-port=3306 --mysql-user=sbtest --mysql-password=sbtestsbtest --mysql-db=sbtest --table_size=20000 --tables=4 --time=120 --threads=4 --skip_trx=off --mysql-ignore-errors=2013,2003,1290,1213 --db-ps-mode=disable --reconnect=1000 oltp_read_write run
Concerning the sysbench test it is worth mentioning that since sysbench is using persistent connection, we had to modify the mysql driver (https://github.com/akopytov/sysbench/blob/master/src/drivers/mysql/drv_mysql.c) in order to close connections and reconnect when specific errors are reported (ER_OPTION_PREVENTS_STATEMENT 1290, CR_CONN_HOST_ERROR 2003). If we didn’t modify it, the actual results would be like the graphs below. As you can see after the failover triggered, when using the cluster’s endpoint there is a total unavailability reporting –> ERROR 1290 The MySQL server is running with the –read-only option so it cannot execute this statement. This means that using the cluster’s endpoint, although the actual writer had already changed, sysbench still tried to send traffic to the former writer. However, as you can see proxySQL recognises almost immediately who is the new writer and redirects the traffic with minimal downtime.
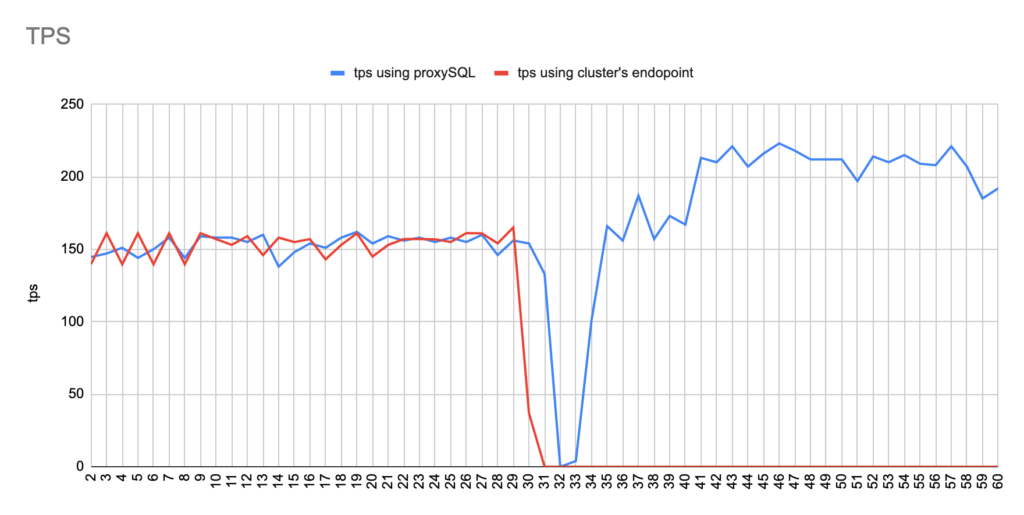
Image 1
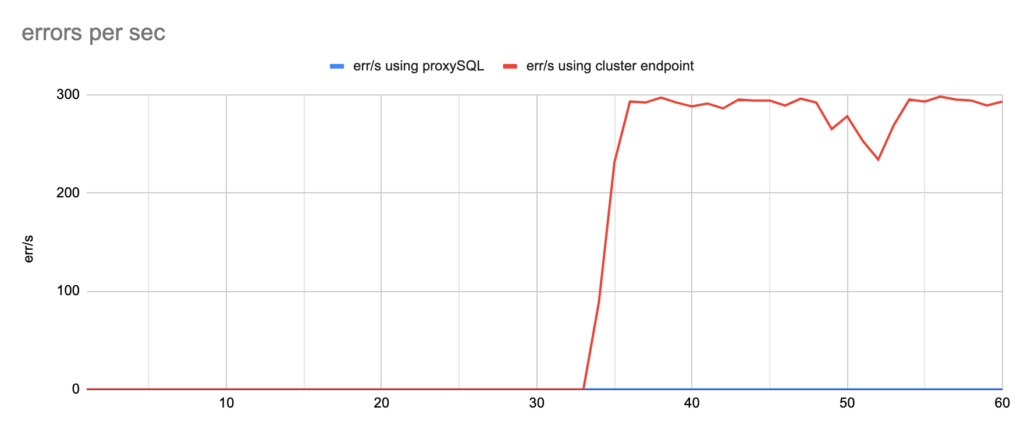
Image 2
So, why is this important to mention? Because if your application is using persistent connection after an unexpected failover using Aurora’s endpoint, you should restart the application in order to get a new connection to the newly promoted writer.
So, we tested 2 different failover scenarios. During the test either the sysbench or bash script was running.
- In the first scenario we just trigger a failover by simply executing the following command
aws rds failover-db-cluster --db-cluster-identifier test-proxysql-cluster.
- In the second scenario we deleted the writer as follows:
WRITER=$( aws rds describe-db-clusters --db-cluster-identifier test-proxysql-cluster| jq -r '.DBClusters[0].DBClusterMembers[] | select(.IsClusterWriter==true) | .DBInstanceIdentifier' | head -n1  ) && \
aws rds delete-db-instance --db-instance-identifier $WRITER
We ran multiple tests and after each and every test we collected data like the TPS, the errors and how much was the total downtime.
Before starting we need to clarify the following:
- There are 2 different failovers executed. One using proxySQL and one using the cluster endpoint. However the time that takes a failover to be triggered using the aws rds failover-db-cluster –db-cluster-identifier test-proxysql-cluster differs. So in the graphs you will sometimes see the traffic to be dropped earlier either in proxySQL or in aurora endpoint test.
- You will notice that in some of the tests when we use cluster’s endpoint there are 2 downtime periods, although we triggered the failover once. This is due to the nature of how the DNS refresh is working on Aurora cluster’s endpoints. So there are actually 2 downtime periods during the same failover.
1st Scenario
1st Test Sysbench
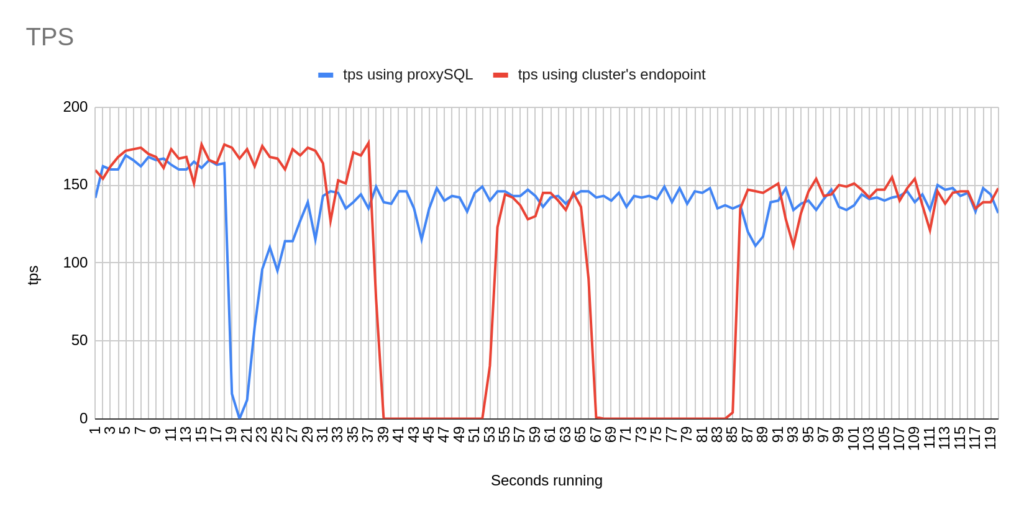
Image 3
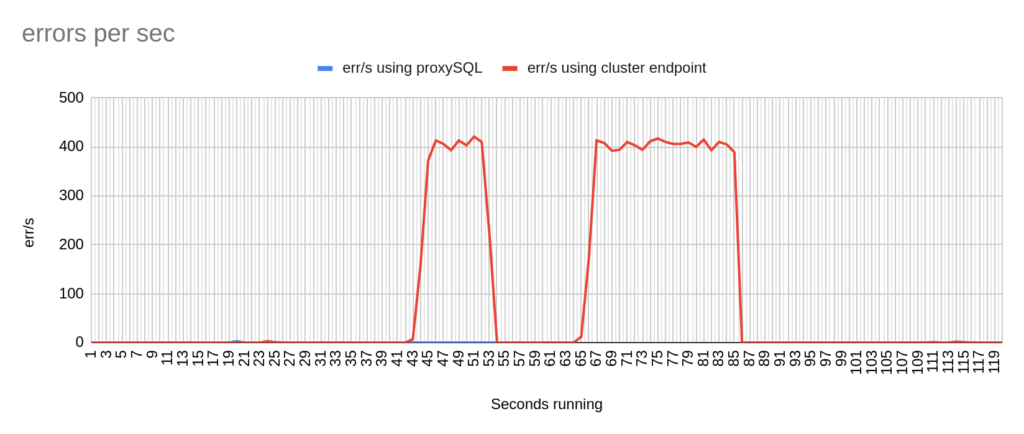
Image 4
Stats using cluster endpoint:
- TOTAL ERRORS: 11464
- ERROR 1290: 11460
- ERROR 2013: 4
- Downtime: ~ 32 seconds
Stats using proxysql:
- TOTAL ERRORS: 3
- ERROR 1290: 0
- ERROR 2013: 3
- Downtime: ~ 2 seconds
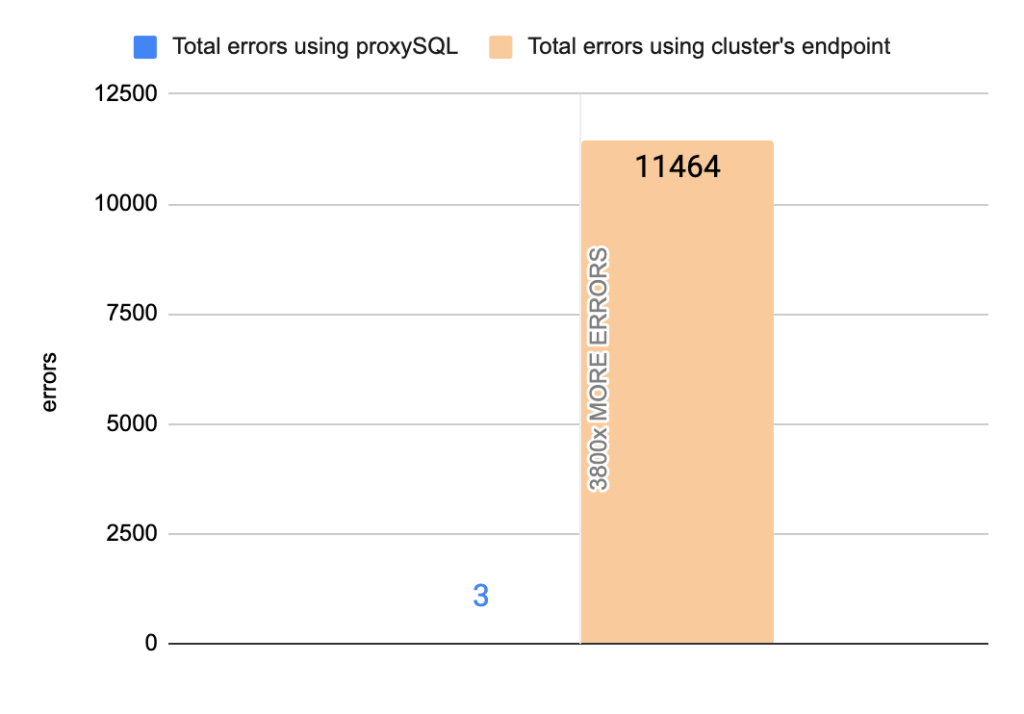
Image 5
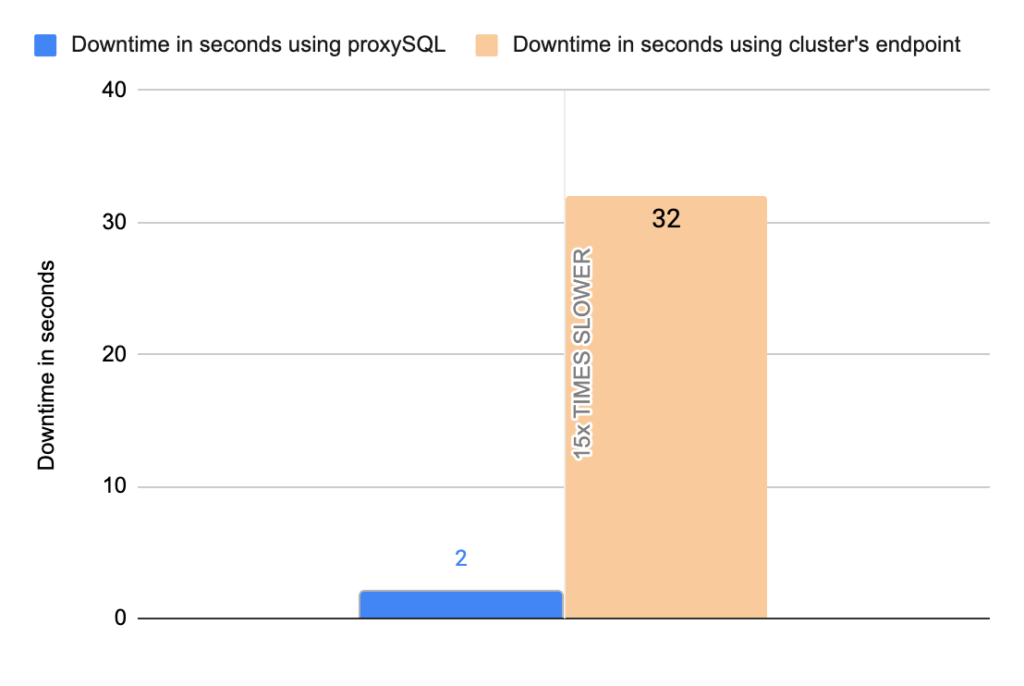
Image 6
2nd Test Sysbench
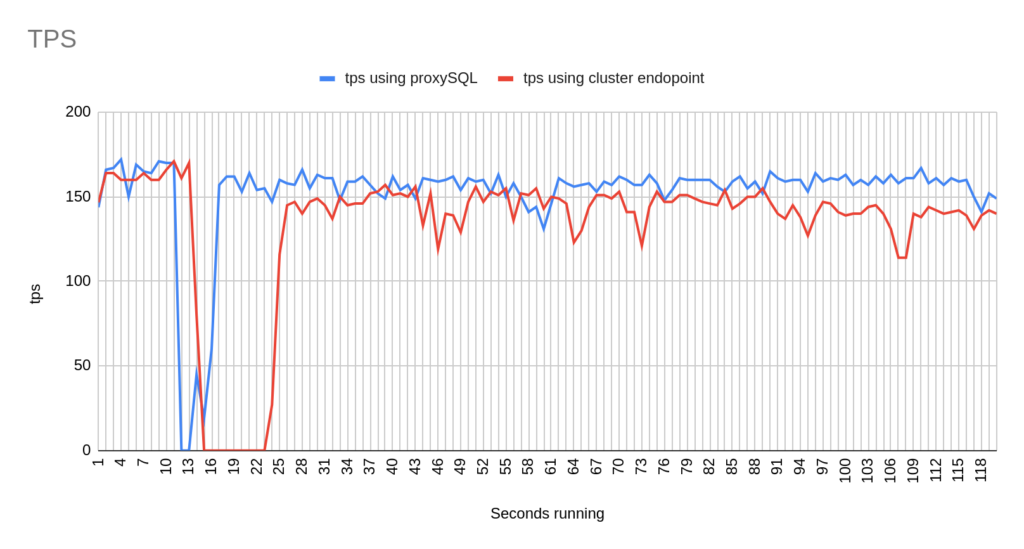
Image 7
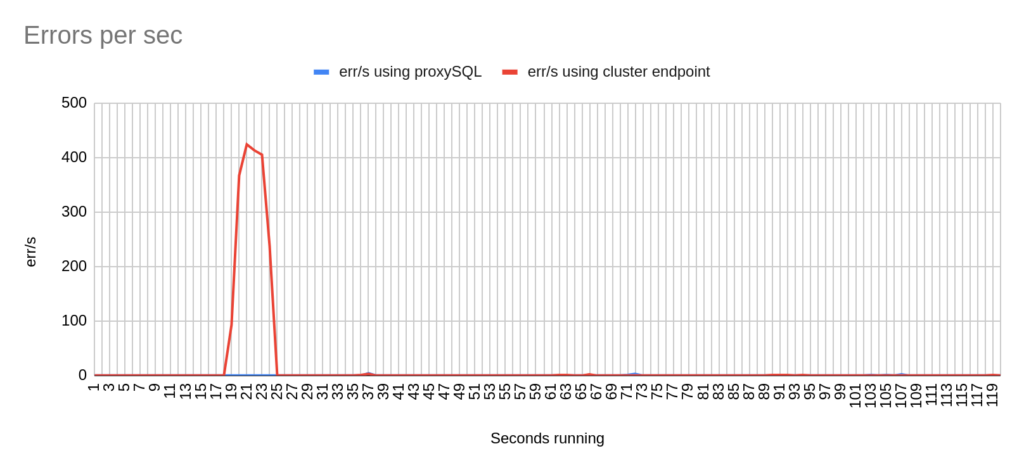
Image 8
Stats using cluster endpoint:
- TOTAL ERRORS: 1938
- ERROR 1290: 1934
- ERROR 2013: 3
- Downtime: ~ 10 seconds
Stats using proxysql:
- TOTAL ERRORS: 1
- ERROR 1290: 0
- ERROR 2013: 1
- Downtime: ~ 2 seconds
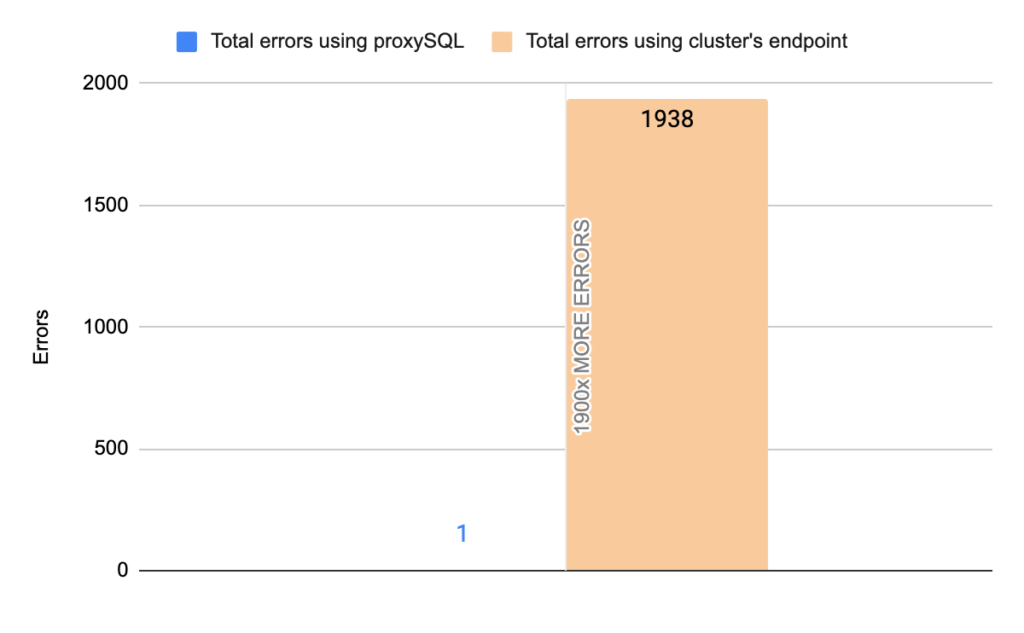
Image 9

Image 10
3rd Test Sysbench
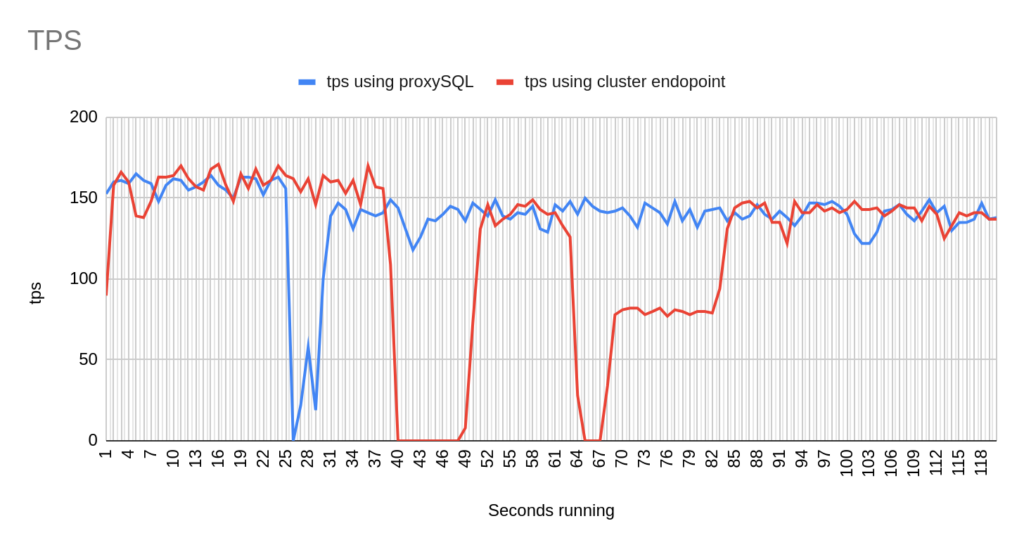
Image 11
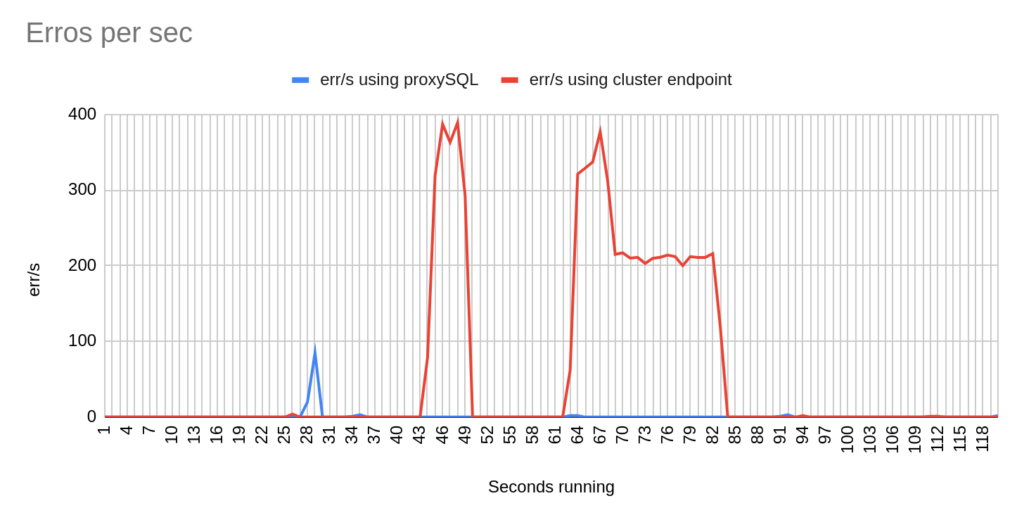
Image 12
Stats using cluster endpoint:
- TOTAL ERRORS: 6619
- ERROR 1290: 6614
- ERROR 2013: 5
- Downtime: ~ 12 seconds
Stats using proxysql:
- TOTAL ERRORS: 105
- ERROR 1290: 104
- ERROR 2013: 1
- Downtime: ~ 3 seconds
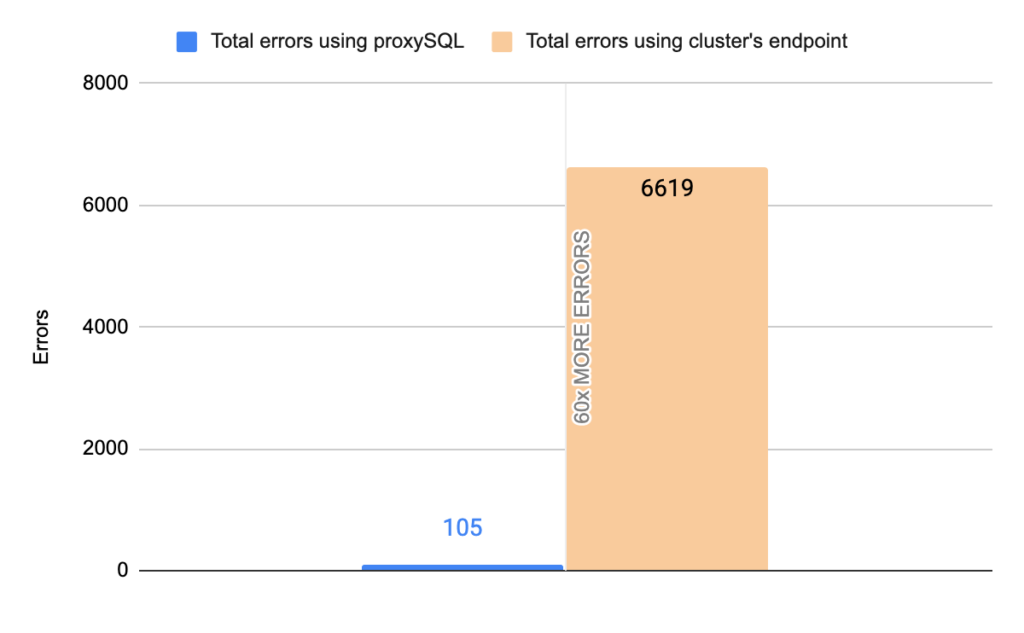
Image 13
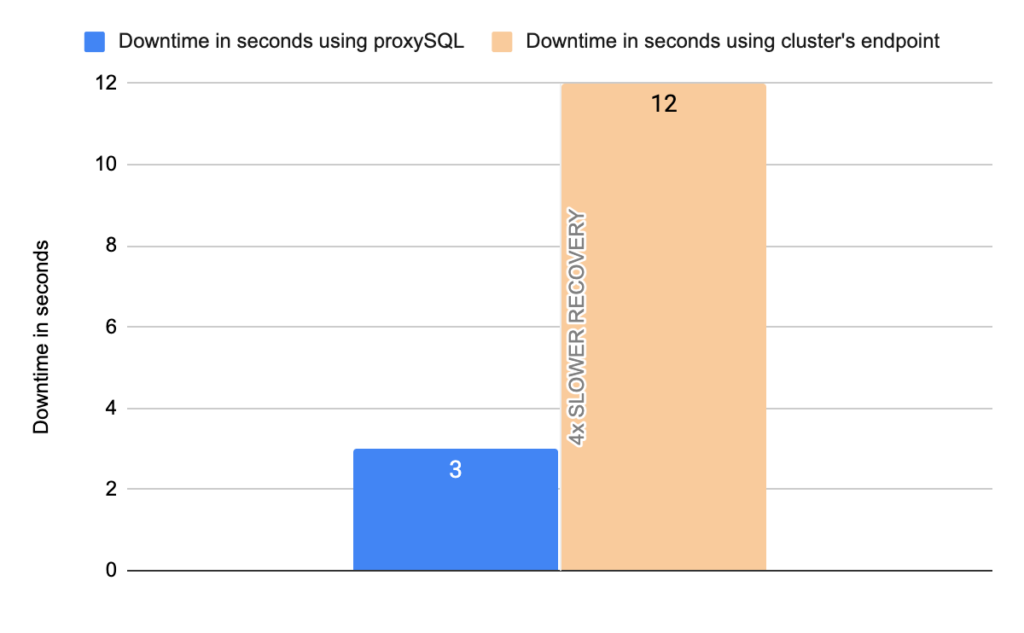
Image 14
4th Test Sysbench
Image 15
Image 16
Stats using cluster endpoint:
- TOTAL ERRORS: 9826
- ERROR 1290: 9822
- ERROR 2013: 4
- Downtime: ~ 25 seconds
Stats using proxysql:
- TOTAL ERRORS: 1
- ERROR 1290: 0
- ERROR 2013: 1
- Downtime: ~ 1 seconds
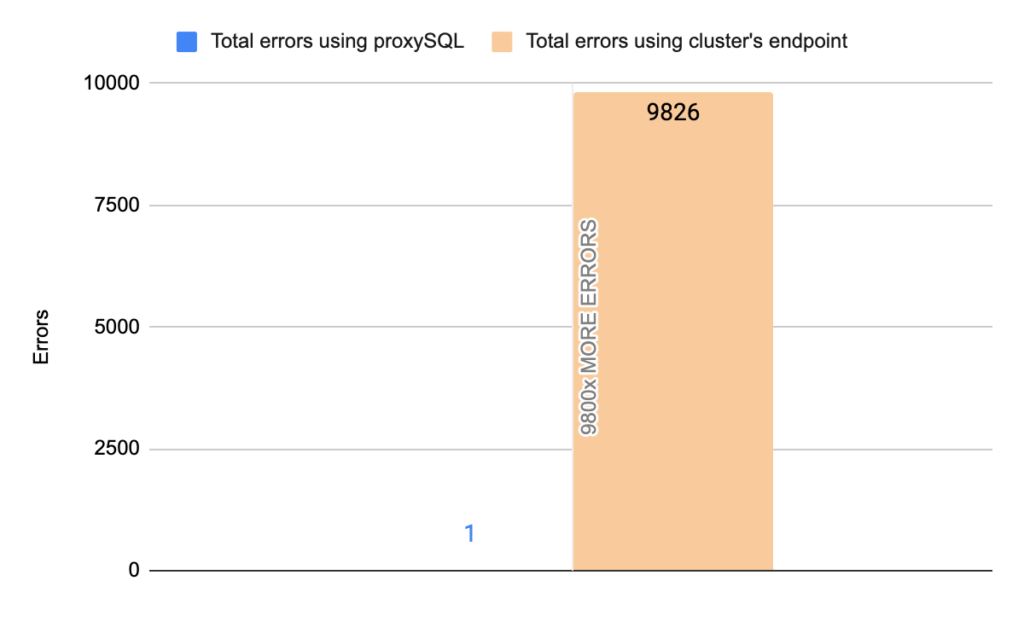
Image 17
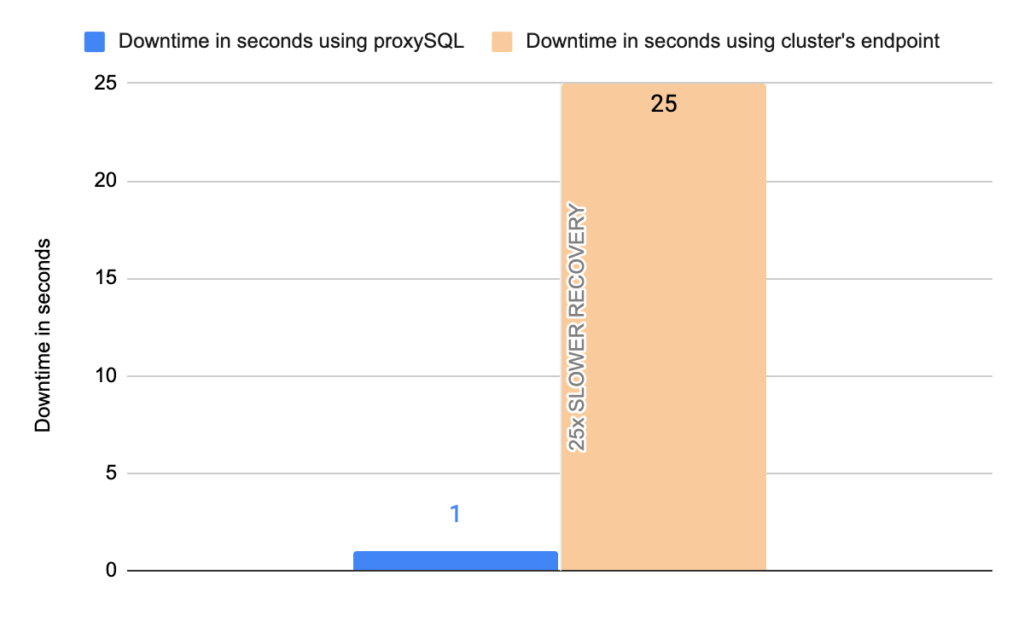
Image 18
The results are impressive and revealed that using proxySQL failover completed in most cases in less than 4 seconds, and the total unavailability was about 3 seconds, while using the cluster’s writer endpoint the downtime varied and in one of the tests took almost 32 seconds. Most of the errors reported were Ignoring error 1290 The MySQL server is running with the –read-only option so it cannot execute this statement and Can’t connect to MySQL server error 2013.
Note that we performed 20 tests but for the sake of space we only present 4 of them. It is worth mentioning that the average downtime using cluster endpoint was 18,7 seconds with max downtime of 63 seconds, and the corresponding average downtime using proxySQL was 2,14 seconds with max of 5 seconds downtime. As concerns the errors the average errors using cluster endpoint was 4876,12 errors/per failover and the average errors using proxysql was 9,15(!!) errors/per failover.
1st Test with mysql-client bash
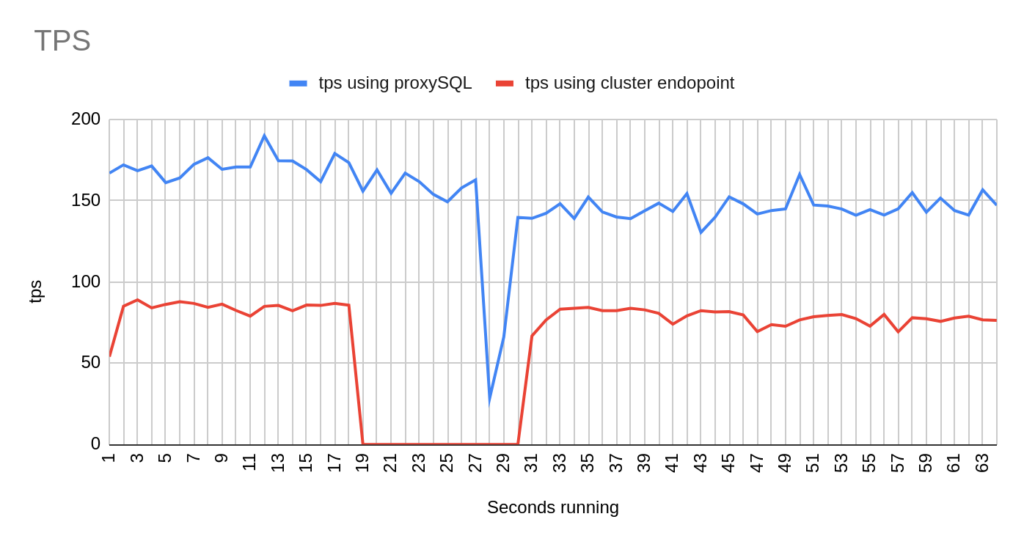
Image 19
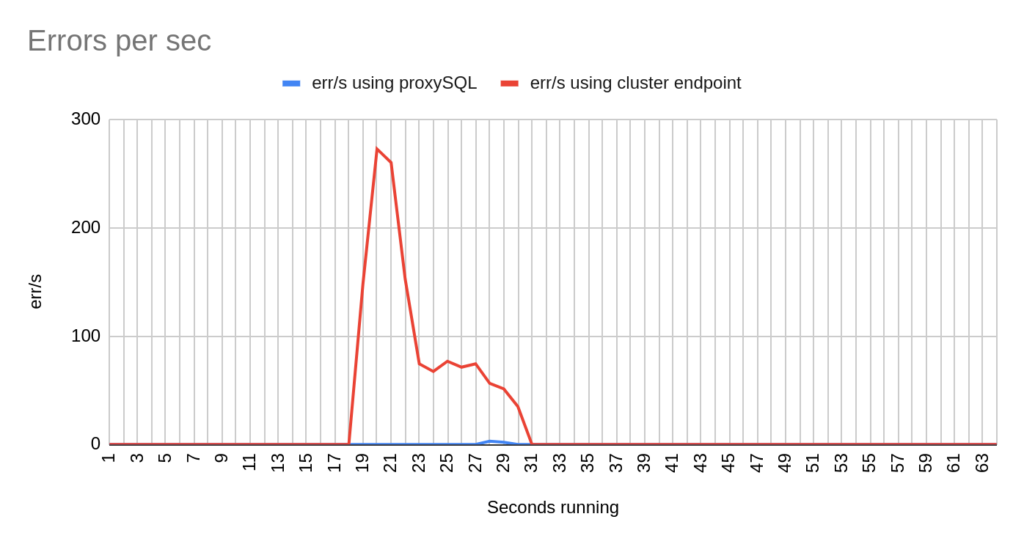
Image 20
Stats using cluster endpoint:
- TOTAL ERRORS: 1204
- ERROR 1290: 432
- ERROR 2013: 3
- ERROR 2003: 769
- Downtime: ~ 15 seconds
Stats using proxysql:
- TOTAL ERRORS: 5
- ERROR 1290: 0
- ERROR 2013: 5
- ERROR 2003: 0
- Downtime: ~ 2 seconds
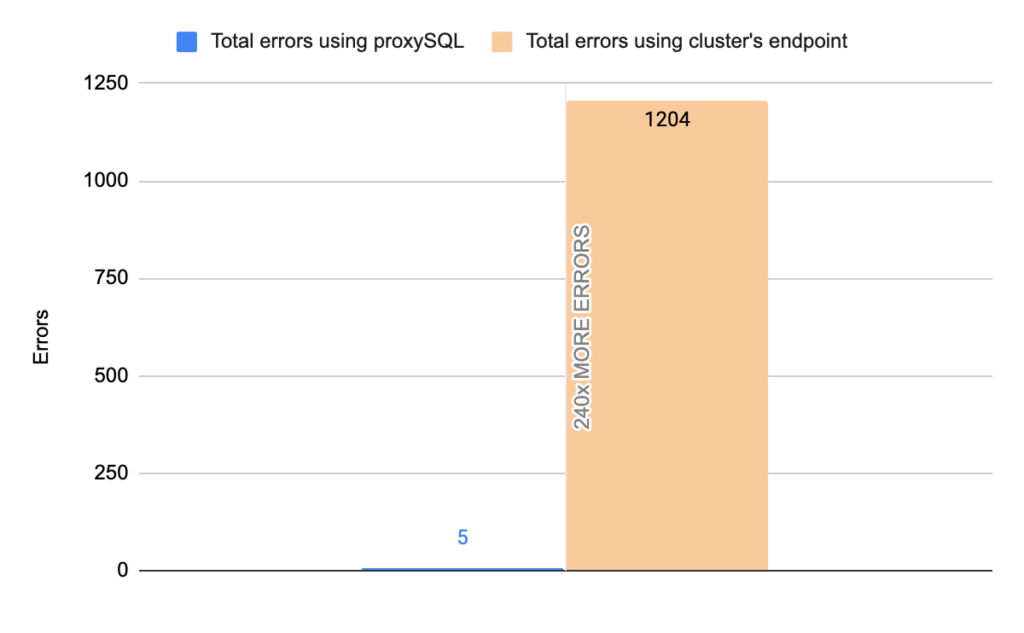
Image 21
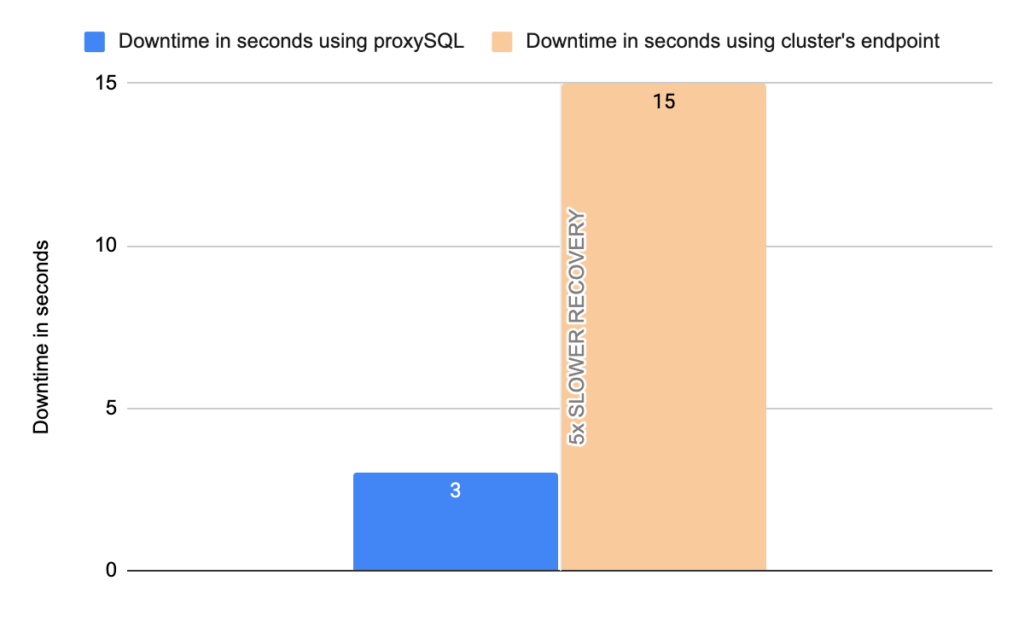
Image 22
2nd Test with mysql-client bash
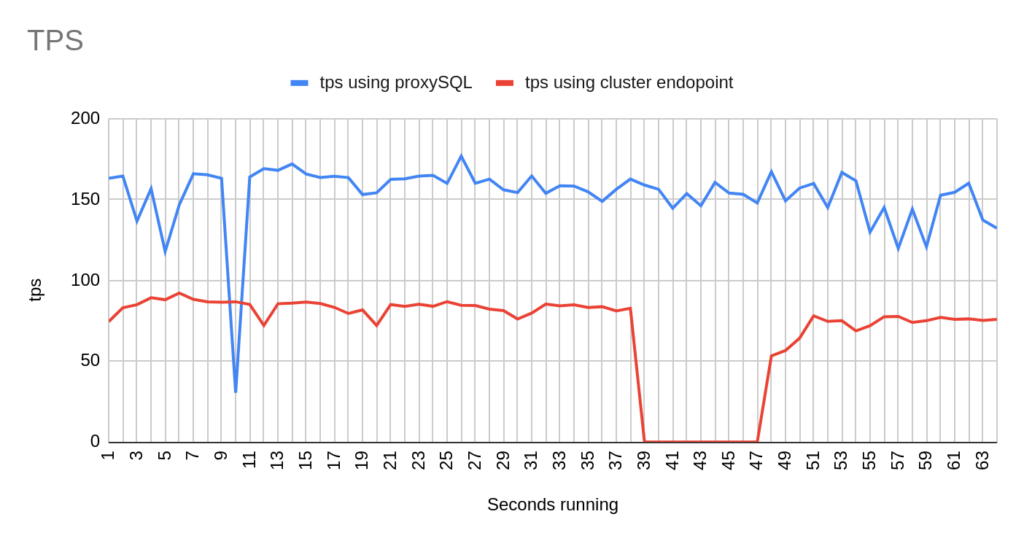
Image 22
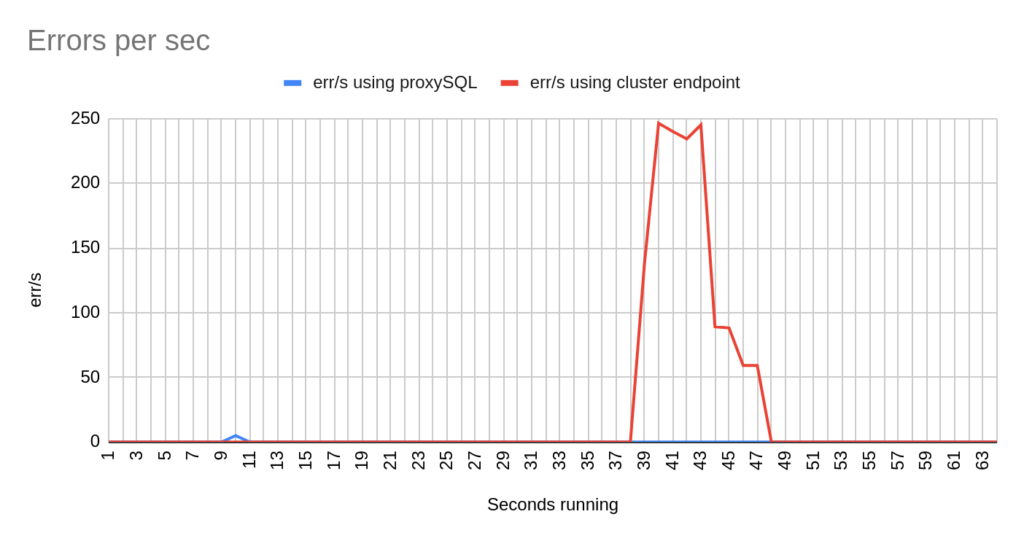
Image 23
Stats using cluster endpoint:
- TOTAL ERRORS: 1317
- ERROR 1290: 208
- ERROR 2013: 4
- ERROR 2003: 1105
- Downtime: ~ 9 seconds
Stats using proxysql:
- TOTAL ERRORS: 5
- ERROR 1290: 0
- ERROR 2013: 5
- ERROR 2003: 0
- Downtime: ~ 2 seconds
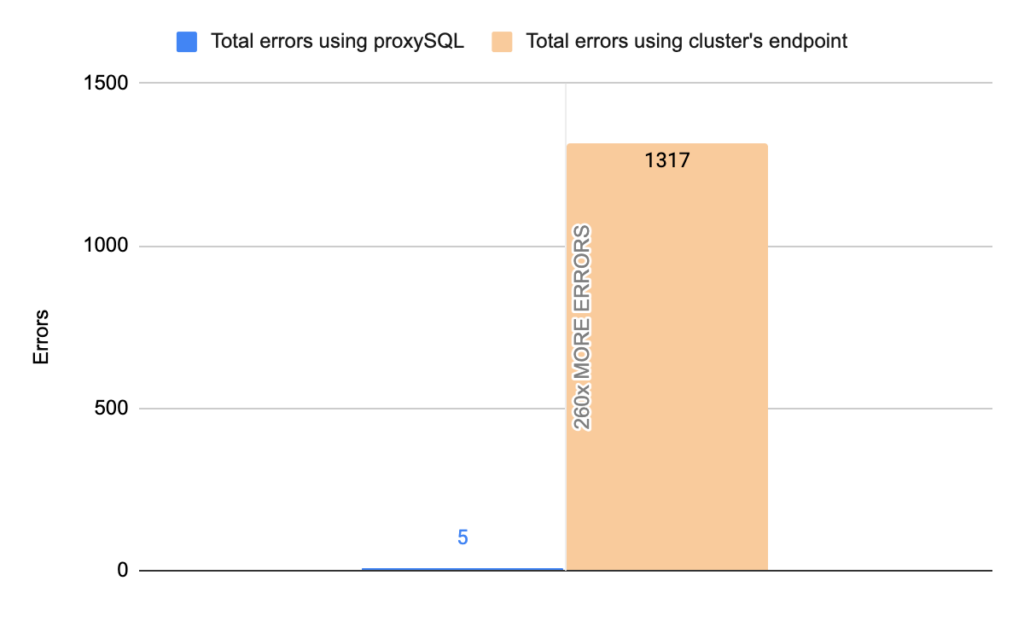
Image 24
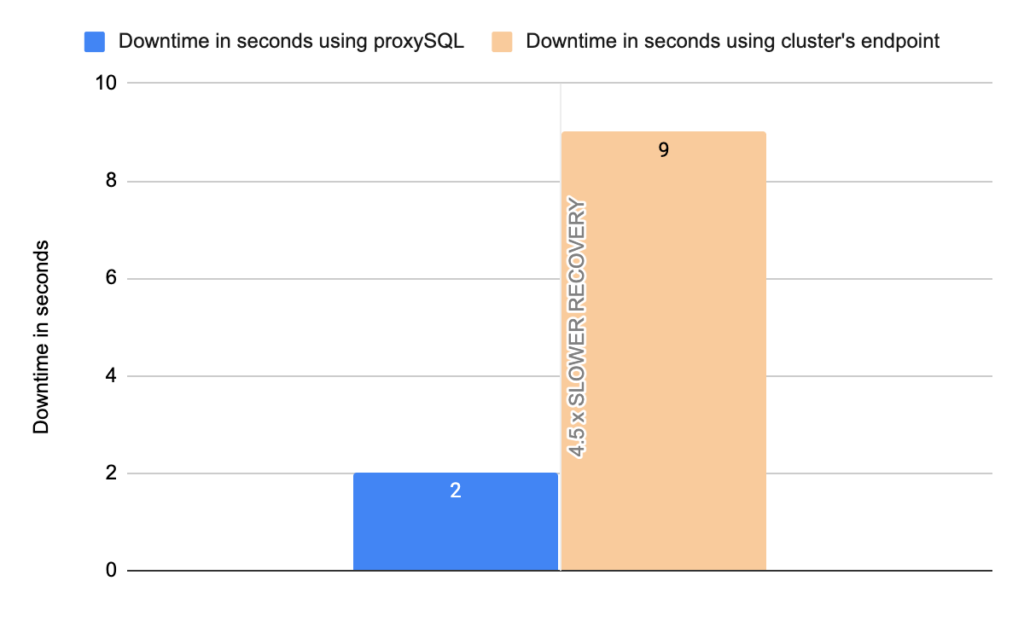
Image 25
3rd Test with mysql-client bash
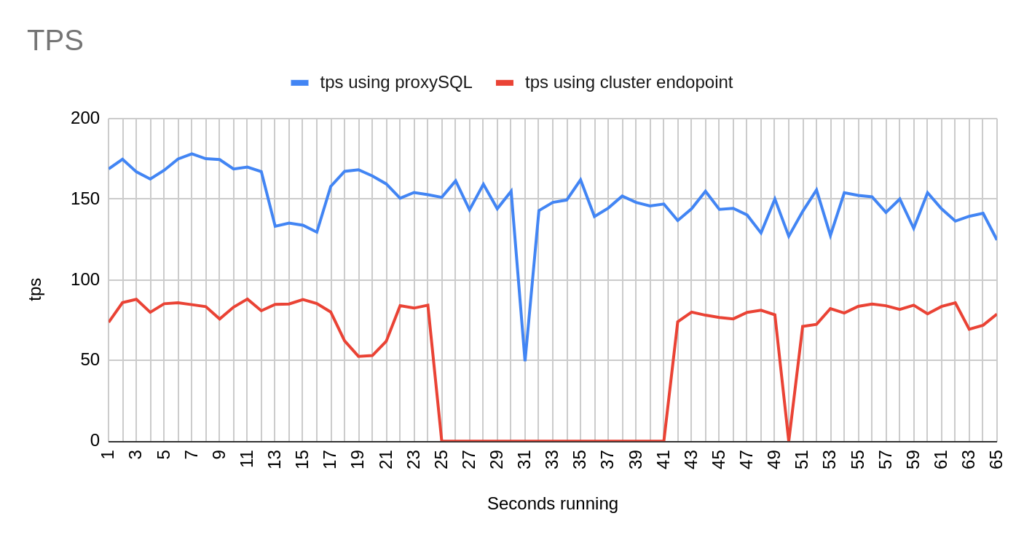
Image 26
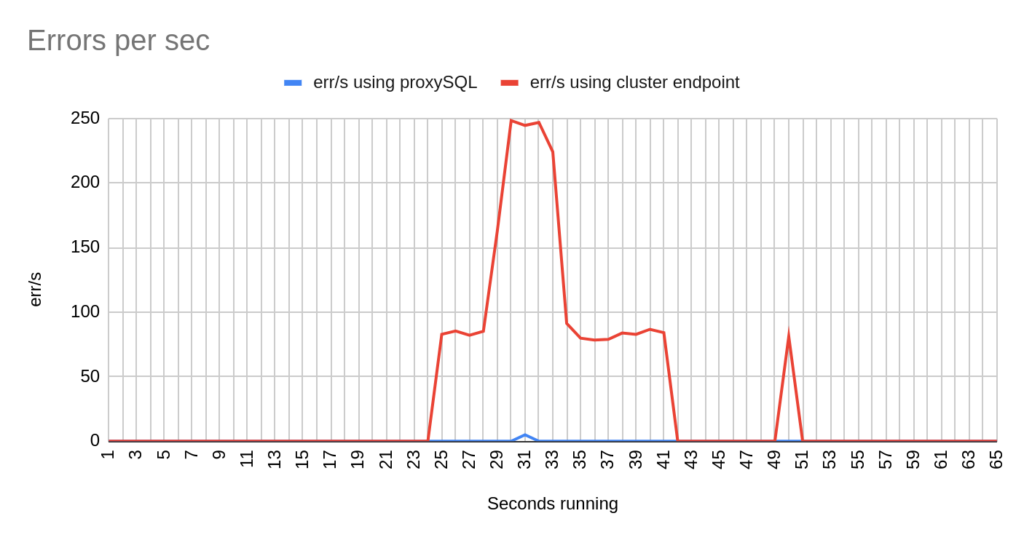
Image 27
Stats using cluster endpoint:
- TOTAL ERRORS: 3342
- ERROR 1290: 2192
- ERROR 2013: 3
- ERROR 2003: 1147
- Downtime: ~ 24 seconds
Stats using proxysql:
- TOTAL ERRORS: 5
- ERROR 1290: 0
- ERROR 2013: 5
- ERROR 2003: 0
- Downtime: ~ 2 seconds
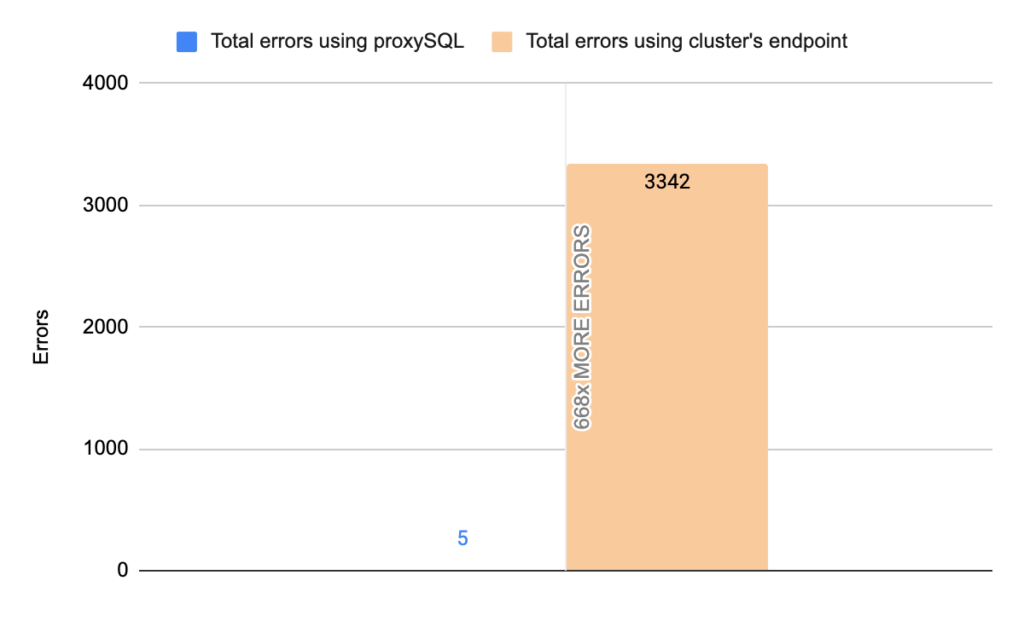
Image 28
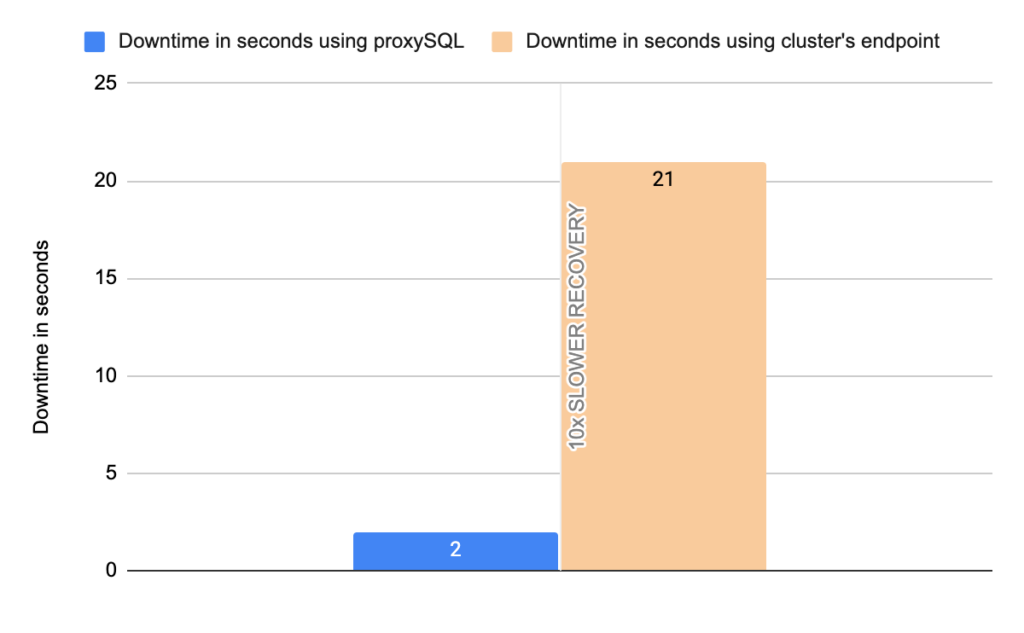
Image 29
Using the mysql-client the results are about the same. Note that the way that this bash script works is to open and close connections for each and every transaction. That’s why here we also see the error Can’t connect to server 2003.
2nd Scenario (Unexpected failover – Deleting writer)
1st Test Sysbench
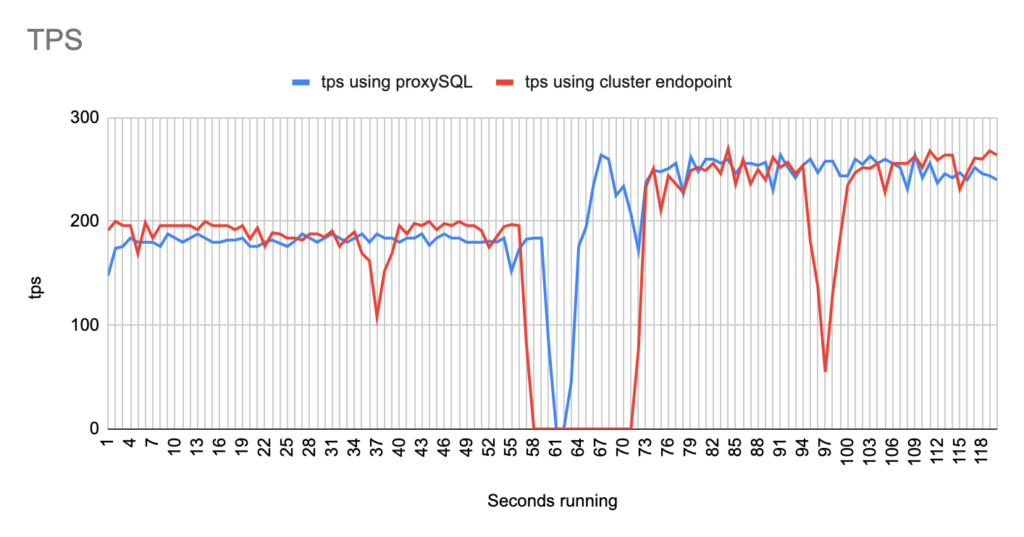
Image 30
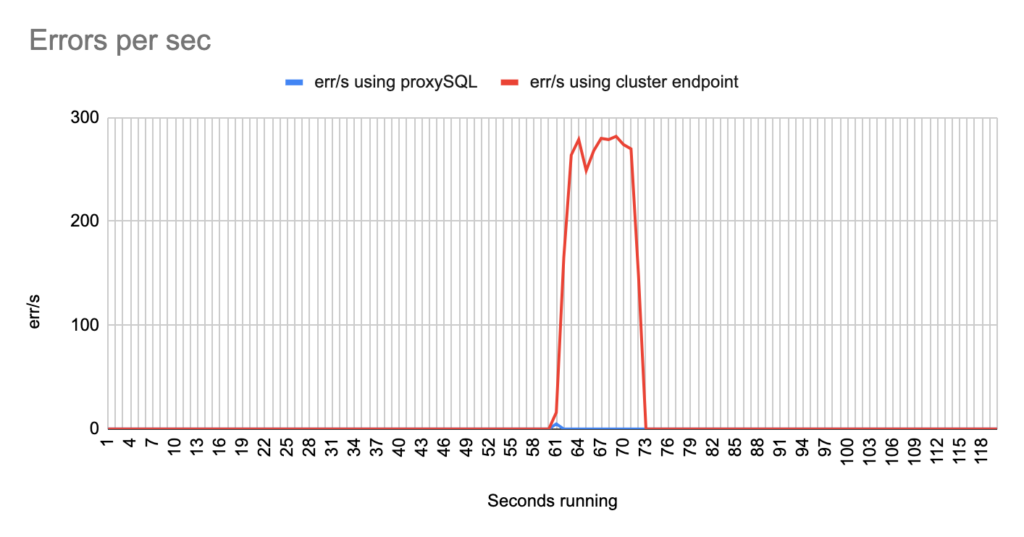
Image 31
Stats using cluster endpoint:
- TOTAL ERRORS: 2772
- ERROR 1290: 2768
- ERROR 2013: 4
- Downtime: ~ 13 seconds
Stats using proxysql:
- TOTAL ERRORS: 4
- ERROR 1290: 0
- ERROR 2013: 4
- Downtime: ~ 2 seconds
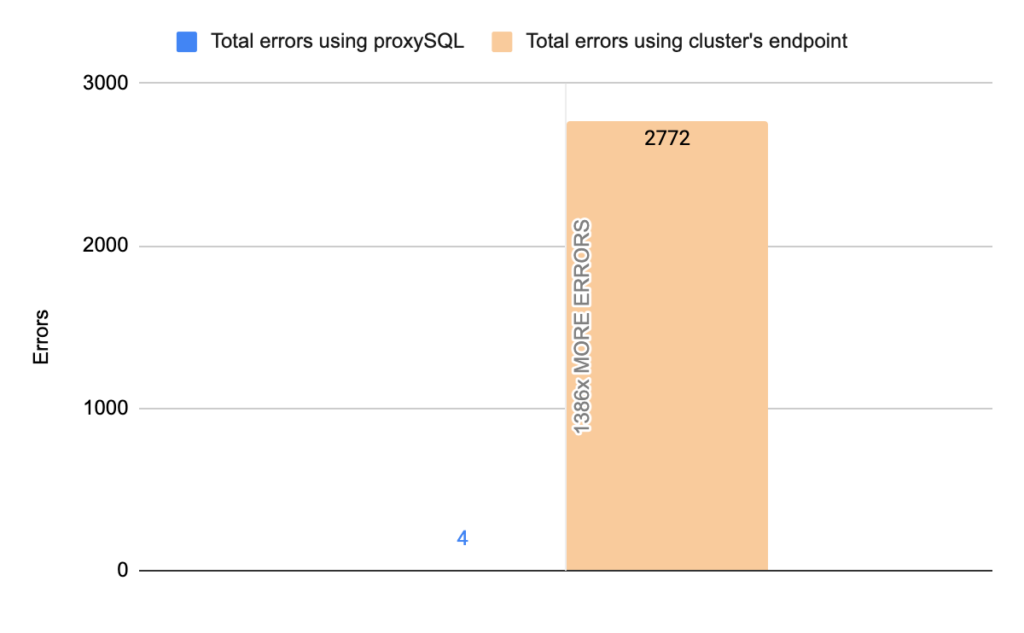
Image 32
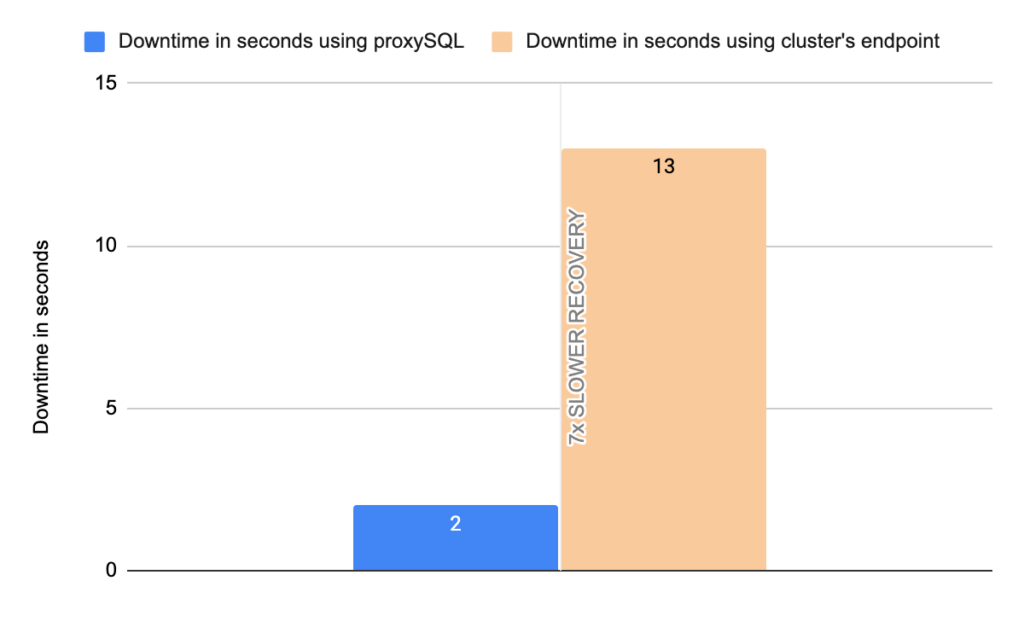
Image 33
2nd Test Sysbench
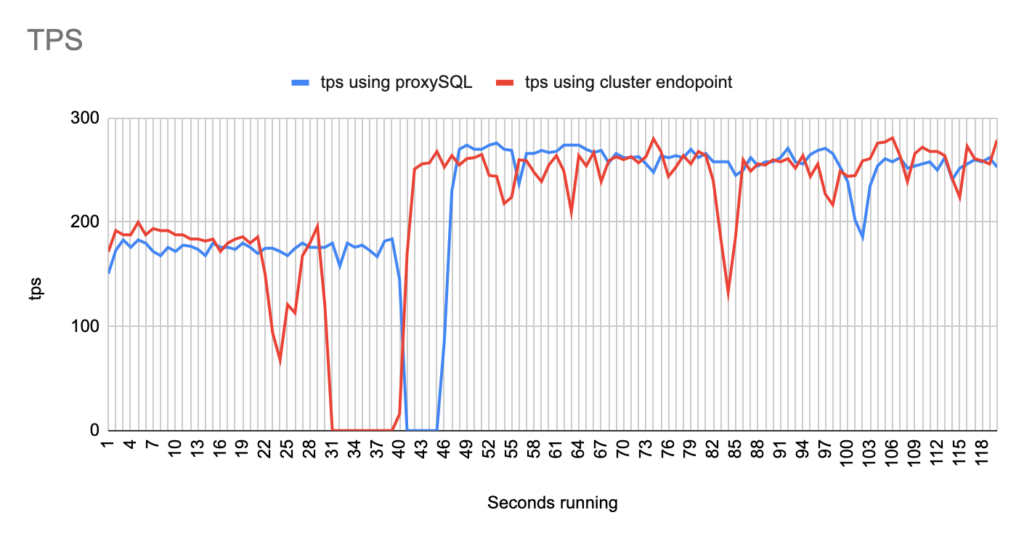
Image 34
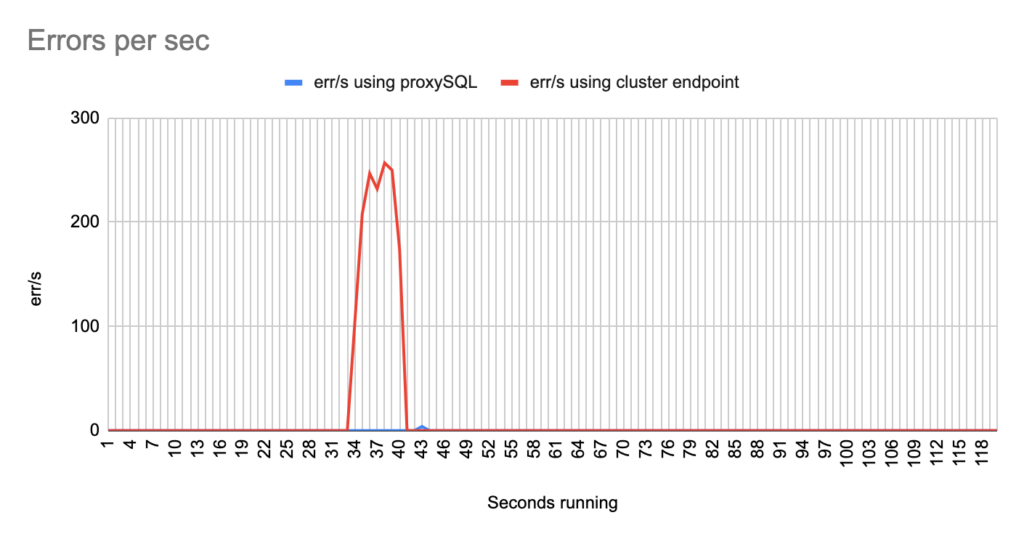
Image 35
Stats using cluster endpoint:
- TOTAL ERRORS: 1470
- ERROR 1290: 1466
- ERROR 2013: 4
- Downtime: ~ 10 seconds
Stats using proxysql:
- TOTAL ERRORS: 4
- ERROR 1290: 0
- ERROR 2013: 4
- Downtime: ~ 4 seconds
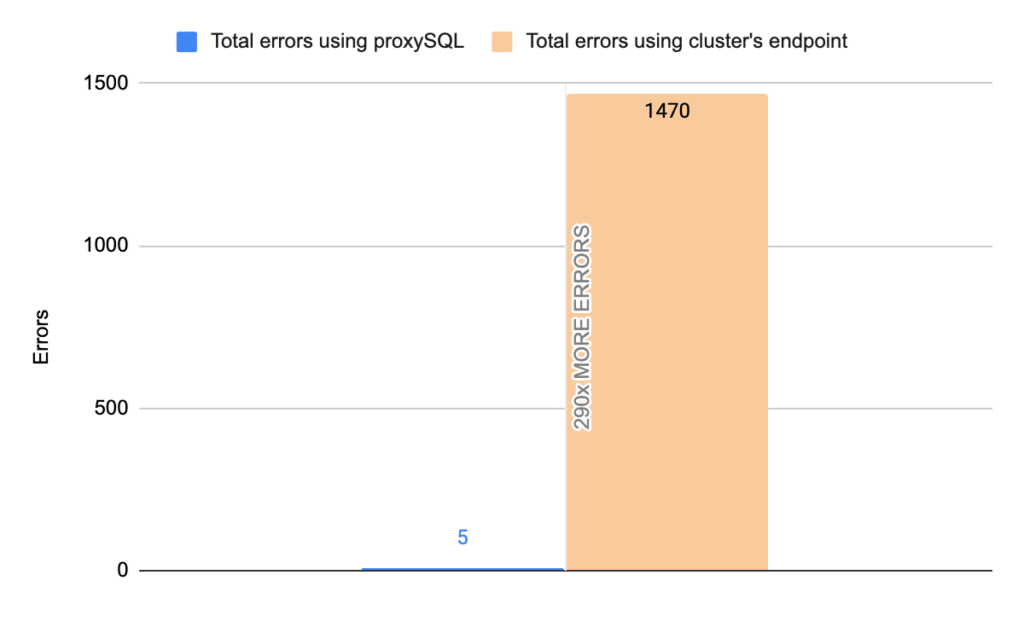
Image 36
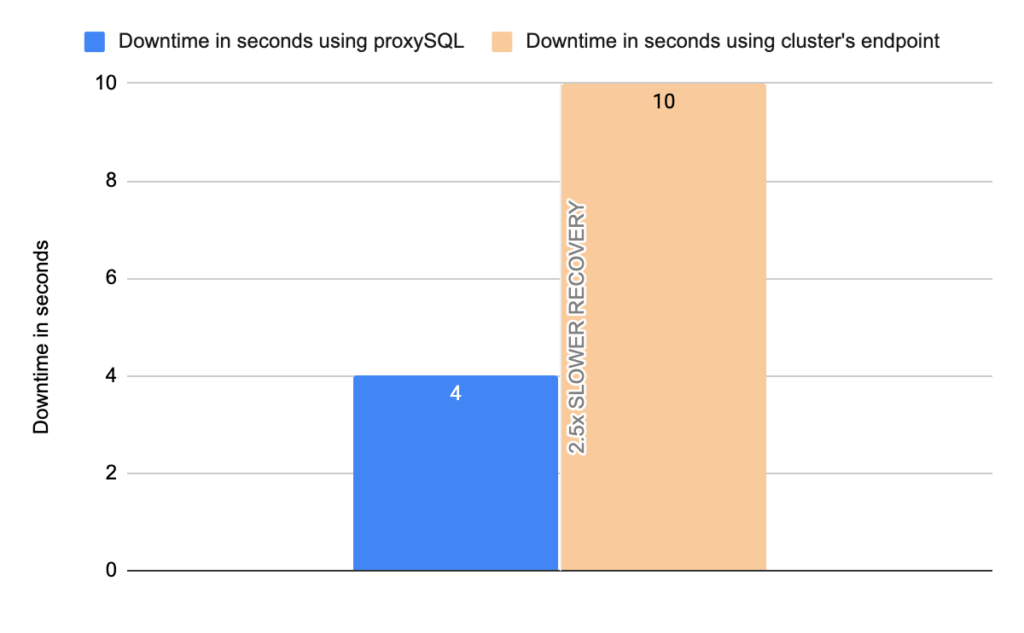
Image 37
Conclusion
So, the question that arrives is how proxySQL achieves this? The impact minimization of a failover is achieved, because proxySQL has in it configured the instance endpoints and polling them frequently to see who is the writer and who is the reader. Thus, when something changes in the status of the instances proxySQL immediately recognizes it and takes the appropriate action.
In more detail, the instances’ endpoints are configured in the mysql_servers. The hostgroups of the writer and the readers are configured in the mysql_aws_aurora_hostgroups table. In mysql_aws_aurora_hostgroups table the column check_interval_ms defines how frequently ProxySQL’s monitor will check the status of the cluster, by default every 1 second. So, ProxySQL’s monitor connects to all the hosts in the cluster and queries the information_schema.replica_host_status every 1 second. The query is executed in one node at time in a round robin fashion. Depending on the answer proxysql decides which is the writer and which is the reader, and subsequently updates the instances’ hostgroup in mysql_servers table. To be more precise ProxySQL determines which one is the writer/master based on SESSION_ID : if the value is MASTER_SESSION_ID, the server specified in the SERVER_ID is the master/writer. All the other servers with SESSION_ID not equal to MASTER_SESSION_ID are replicas. So, whenever a failover happens proxySQL will understand it at most within 1 second. Then proxySQL triggers a procedure in order to update the mysql_servers table with the new writer. Whenever Aurora updates the information_schema.replica_host_status table with the new writer proxySQL within at most 1 second will update the hostgroups in the mysql_servers table based on the answer received by the instances. In comparison, this update in the cluster’s endpoint is done by updating its DNS record, which is taking from 5x times up to 25x times to be done, based on our tests.
Another great improvement that proxySQL offers are the errors. The errors a client receives can be minimized up to ~3500x. This happens due to the following two reasons.
- ProxySQL minimizes downtime as we already mentioned. So less errors are received. But the reason why it achieves this impressive number of 3500x times better is mainly because of the 2nd reason.
- ProxySQL holds in a “queue” (not an actual queue) the sessions that cannot be served by a hostgroup. How much time this session can be held is determined by the mysql-connect_timeout_server_max variable. This variable configures the maximum timeout for retrying to connect from proxysql to a backend in a hostgroup. In more detail, when proxysql tries to establish a connection to a backend and the attempt fails due to timeout after mysql-connect_timeout_server milliseconds, proxysql will retry to establish a new connection (against the same backend or another backend in the same hostgroup) according to parameters mysql-connect_retries_on_failure and mysql-connect_retries_delay. ProxySQL stops retryning when the final timeout of mysql-connect_timeout_server_max milliseconds is reached, and an error is returned to the client with code 9001 with the message “Max connect timeout reached while reaching hostgroup…”.
So what is next? The next thing we want to discuss in the upcoming blog is the setup of proxySQL for MySQL in Azure. Stay tuned!