ProxySQL 3.1.6: Embedded TSDB for Built-in Time-Series Metrics
ProxySQL 3.1.6: Built-in Time-Series Metrics with the Embedded TSDB
Every ProxySQL deployment already exposes Prometheus metrics. If you have a Prometheus + Grafana stack, you scrape them, store them, and build dashboards. But not every environment has that infrastructure — and even those that do sometimes need a quick way to answer “what happened 3 hours ago?” without leaving the ProxySQL admin interface.
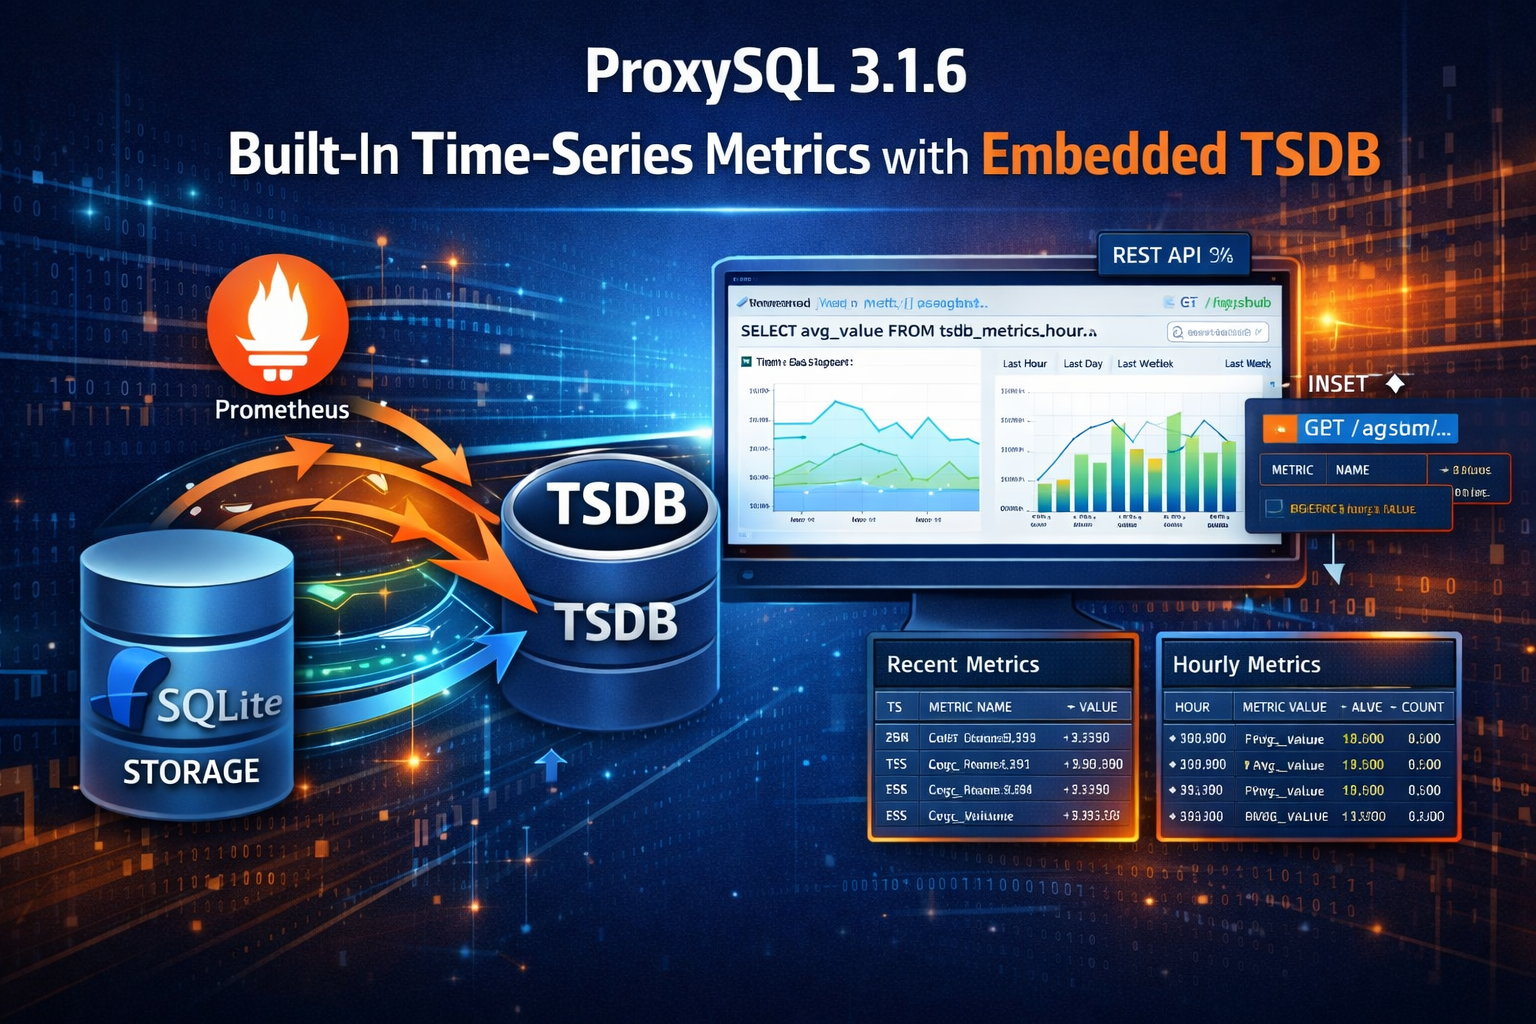
ProxySQL 3.1.6 introduces the Embedded TSDB — a built-in time-series database that persistently records all ProxySQL metrics, with automatic aggregation, configurable retention, and a web dashboard. No external dependencies required.
Why an Embedded TSDB?
ProxySQL has always been a self-contained system. Configuration lives in SQLite. Stats are queryable via SQL. The admin interface is a MySQL-compatible CLI. This philosophy of operational simplicity is one of ProxySQL’s core strengths.
But metrics were the exception. ProxySQL could expose Prometheus metrics, but it couldn’t store them. If you wanted to know what your connection pool looked like yesterday, you needed an external time-series database. For small deployments, edge locations, development environments, or air-gapped systems, that’s a lot of infrastructure for a simple question.
The Embedded TSDB brings metrics storage inside ProxySQL itself:
- No external dependencies — metrics are stored in the existing
statsdb_diskSQLite database - SQL-queryable — use the same admin interface you already know
- Automatic aggregation — raw samples are rolled up to hourly granularity for long-term storage
- Configurable retention — keep raw data for days, aggregates for up to a year
- Built-in dashboard — a web UI for visual exploration, no Grafana required
Architecture
The TSDB integrates directly into ProxySQL’s existing statistics infrastructure:
Prometheus Registry
       │
       ▼
  TSDB Sampler Loop (every N seconds)
       │
       ├──► tsdb_metrics (raw samples)
       │         │
       │    Hourly Downsample
       │         │
       │         ▼
       │    tsdb_metrics_hour (aggregates)
       │
       └──► tsdb_backend_health (optional TCP probes)
Raw Metrics: tsdb_metrics
Every tsdb-sample_interval seconds (default: 5), the TSDB sampler collects all metric families from ProxySQL’s built-in Prometheus registry. This includes every metric type:
- Counters (e.g.,
proxysql_mysql_query_rules_total) - Gauges (e.g.,
proxysql_connpool_conns_used) - Histograms (e.g., query latency buckets)
- Summaries (quantiles)
Each sample is stored with its timestamp, metric name, labels (as JSON), and value.
Hourly Rollups: tsdb_metrics_hour
Every hour, raw samples are aggregated into tsdb_metrics_hour with AVG, MAX, MIN, and COUNT for each metric/label combination. This gives you trend analysis over days and weeks without retaining every 5-second sample.
Rollups are retained for 365 days — long enough for capacity planning and year-over-year comparisons.
Backend Health Probes: tsdb_backend_health
When tsdb-monitor_enabled=1, the TSDB runs periodic TCP probes against all servers in runtime_mysql_servers. Each probe records:
- Whether the server responded (
probe_up) - Connection latency in milliseconds (
connect_ms)
This gives you a lightweight, independent health timeline for every backend — useful for correlating application issues with backend availability.
Getting Started
Enable TSDB
-- Enable the TSDB
SET tsdb-enabled=1;
LOAD TSDB VARIABLES TO RUNTIME;
SAVE TSDB VARIABLES TO DISK;

-- Verify
SHOW TSDB STATUS;
That’s it. Metrics start flowing immediately.
Optional: Enable Backend Health Probes
SET tsdb-monitor_enabled=1;
LOAD TSDB VARIABLES TO RUNTIME;
SAVE TSDB VARIABLES TO DISK;
Configuration Reference
| Variable | Default | Range | Description |
|---|---|---|---|
tsdb-enabled | 0 | 0/1 | Master switch |
tsdb-sample_interval | 5 | 1–3600 sec | How often metrics are sampled |
tsdb-retention_days | 7 | 1–3650 days | Raw data and probe retention |
tsdb-monitor_enabled | 0 | 0/1 | Enable backend TCP probes |
tsdb-monitor_interval | 10 | 1–3600 sec | Backend probe frequency |
All variables follow the standard ProxySQL pattern: SET, LOAD ... TO RUNTIME, SAVE ... TO DISK.
Querying Metrics via SQL
Since the TSDB is stored in SQLite, you query it through the ProxySQL admin interface — the same place you manage everything else.
Recent raw samples (last 5 minutes)
SELECT datetime(timestamp,'unixepoch') AS ts,
       metric_name, labels, value
FROM stats_history.tsdb_metrics
WHERE timestamp > unixepoch() - 300
ORDER BY timestamp DESC
LIMIT 50;
Hourly trends (last 24 hours)
SELECT datetime(bucket,'unixepoch') AS hour,
       metric_name, avg_value, max_value, min_value, count
FROM stats_history.tsdb_metrics_hour
WHERE bucket > unixepoch() - 86400
ORDER BY bucket;
Backend health (last hour)
SELECT datetime(timestamp,'unixepoch') AS ts,
       hostgroup, hostname, port, probe_up, connect_ms
FROM stats_history.tsdb_backend_health
WHERE timestamp > unixepoch() - 3600
ORDER BY timestamp DESC;
Connection pool utilization trend
SELECT datetime(bucket,'unixepoch') AS hour,
       labels, avg_value, max_value
FROM stats_history.tsdb_metrics_hour
WHERE metric_name = 'proxysql_connpool_conns_used'
  AND bucket > unixepoch() - 86400
ORDER BY bucket;
Web Dashboard
ProxySQL 3.1.6 includes a built-in web dashboard at:
http://<proxysql_host>:6080/tsdbThe dashboard provides:
- Interactive metric selection from all collected metrics
- Time range picker (Last Hour, Last Day, Last Week)
- Chart.js-powered visualization
- No external dependencies — the dashboard is self-contained HTML served by ProxySQL’s built-in HTTP server
This is particularly useful for quick investigations. Instead of switching to Grafana or writing SQL queries, you can pull up the dashboard and visually scan for anomalies.
REST API
For programmatic access or integration with external tools, the TSDB exposes a REST API:
GET /api/tsdb/metrics— list all available metric namesGET /api/tsdb/query— query time-series data with filters (metric name, time range, aggregation, label filters)GET /api/tsdb/status— TSDB system status
This makes it straightforward to integrate ProxySQL metrics into custom dashboards, alerting systems, or automation scripts — even without Prometheus.
Use Cases
Small deployments and edge locations: A single ProxySQL instance serving a small application doesn’t need a full Prometheus + Grafana stack. Enable TSDB and you have a week of metric history available via SQL.
Development and staging environments: Developers can check query patterns, connection pool behavior, and backend health without access to production monitoring infrastructure.
Incident investigation: “What happened at 3 AM?” becomes a SQL query instead of a Grafana expedition. The data is right there in the admin interface.
Air-gapped and restricted environments: Systems without external network access can still maintain full metric history and trend analysis.
Capacity planning: Hourly rollups retained for a year give you the data you need for growth projections and resource planning — queryable in SQL, exportable via the REST API.
Complementing Prometheus: Even if you run a full Prometheus stack, the embedded TSDB provides a local cache of metrics that’s always available. If your Prometheus server has a gap, ProxySQL’s local TSDB still has the data.
Storage Considerations
The TSDB uses SQLite’s efficient WITHOUT ROWID tables with compound primary keys. Storage usage depends on your metric cardinality and sample interval:
- At the default 5-second interval with typical ProxySQL metrics, expect roughly 10–50 MB per day of raw data
- Hourly rollups are dramatically smaller — typically under 1 MB per day
- The 7-day default retention keeps raw data manageable; adjust based on your disk budget
The retention cleanup runs automatically — no cron jobs or manual maintenance required.
Conclusion
The Embedded TSDB makes ProxySQL fully self-sufficient for metric storage and analysis. Whether you’re running a single-node development setup or a fleet of proxies with a full monitoring stack, having persistent, queryable, SQL-accessible metric history built into ProxySQL itself is a capability that simplifies operations across the board.
ProxySQL 3.1.6 is available now. Enable TSDB with three SQL commands and start exploring your metric history.